


Images & Movies
Fusion
 Clean Energy for the Future with the ITER Reactor (Video clip 133MB)Jamison Daniel (ORNL), David Pugmire (ORNL), Michael Matheson (ORNL), Sean Ahern (ORNL) ** SciDAC VisNight 2010 Winner! ** |
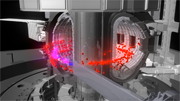
Left: Fusion energy production by alpha particle injection |
||
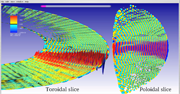
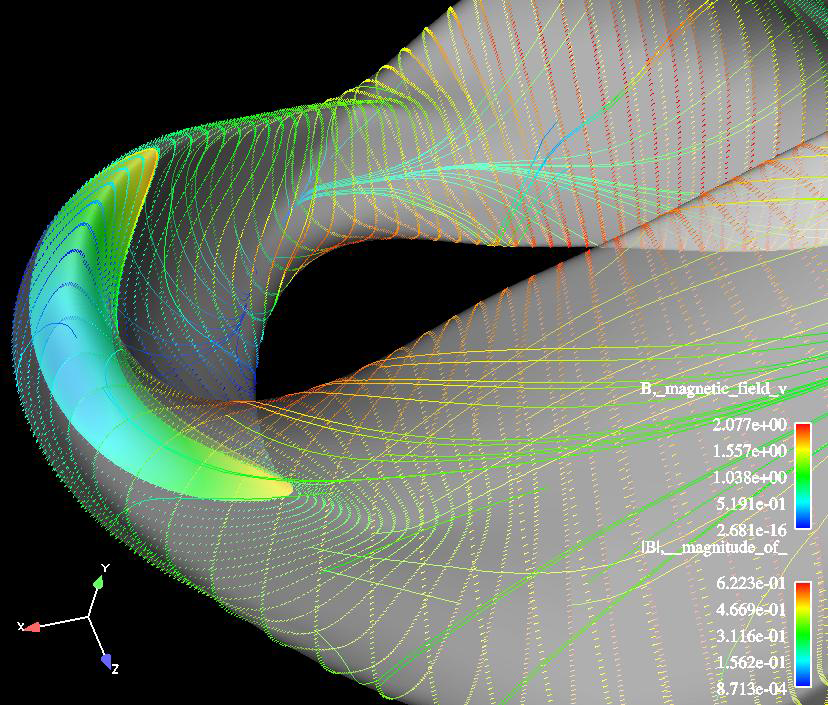
 Streamlines showing the magnetic field in NIM-ROD fusion simulation output. |
 Streamlines showing fluid flow in data produced by the NEK3D thermal hydraulics simulation. |
||
Computing Streamlines in Parallel A major goal of the SciDAC Fusion Energy initiative is to create an integrated model for the simulation of magnetically confined fusion. One powerful tool used to aid scientists in the validation and verification of these models is topological analysis and visualization. These tools allow the scientists to explore, classify and visualize features in the magnetic field of the reactor core. Central to many of these analysis tools is the generation of streamlines in the magnetic field to create Poincar� plots; the intersection points of streamlines with a poloidal plane. In this visualization, we show recent work in enabling these analysis tools to run in parallel on multi-block data sets, allowing scientists to interact with much larger data sets and perform much more computationally intensive analysis and visualization. This movie shows streamlines computed on a Siesta dataset that is decomposed into 64 spatial domains. Simulation data provided by Raul Sanchez and Steve Hirshman using the Siesta code on flagship computers at the National Energy Research Center. Research funded by the Laboratory Directed Research Development program at ORNL. Visualization performed by Dave Pugmire using the VisIt Visualization Package. Support provided by the DOE Scientific Discovery Through Advanced Computing (SciDAC) Project. |
|||
Video Clip (6.9MB) |
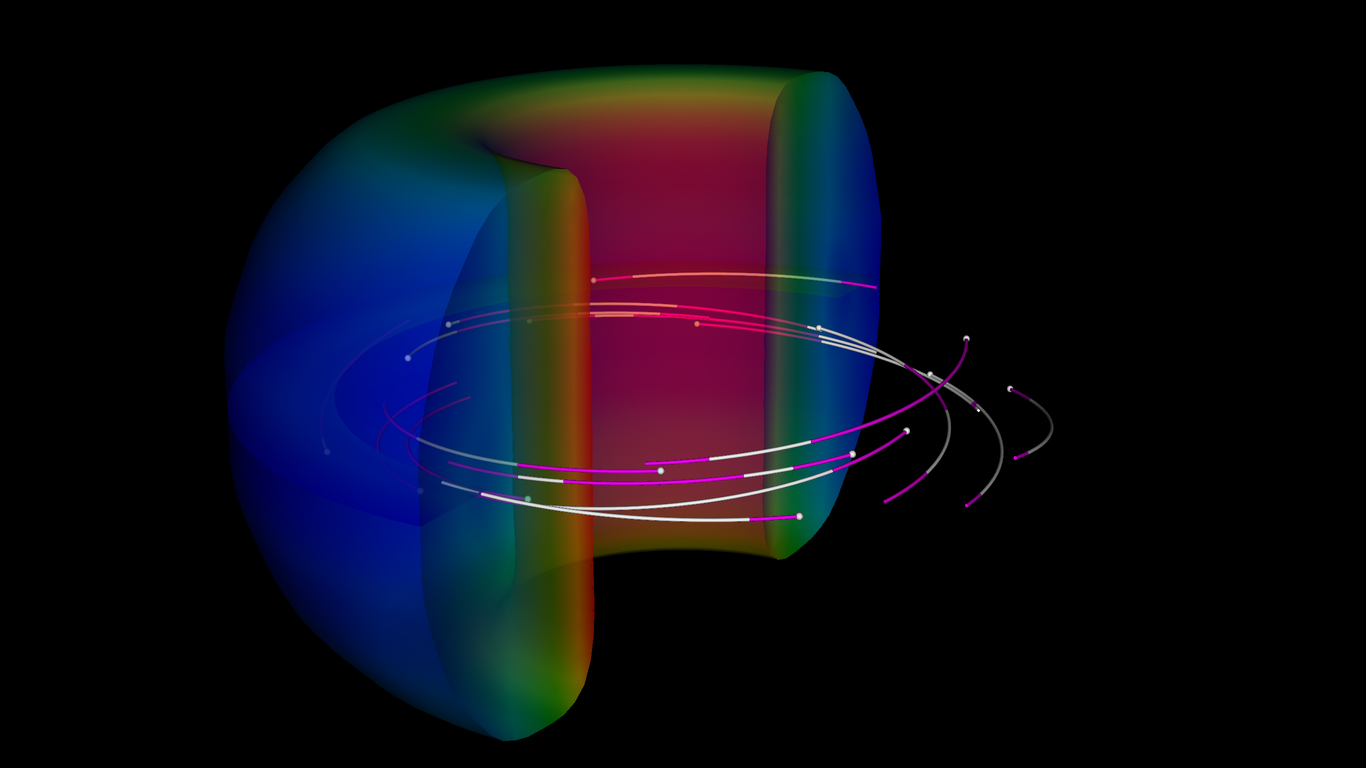
Fig 2. Seeds placed randomly within the tokamak are used for streamline generation. |
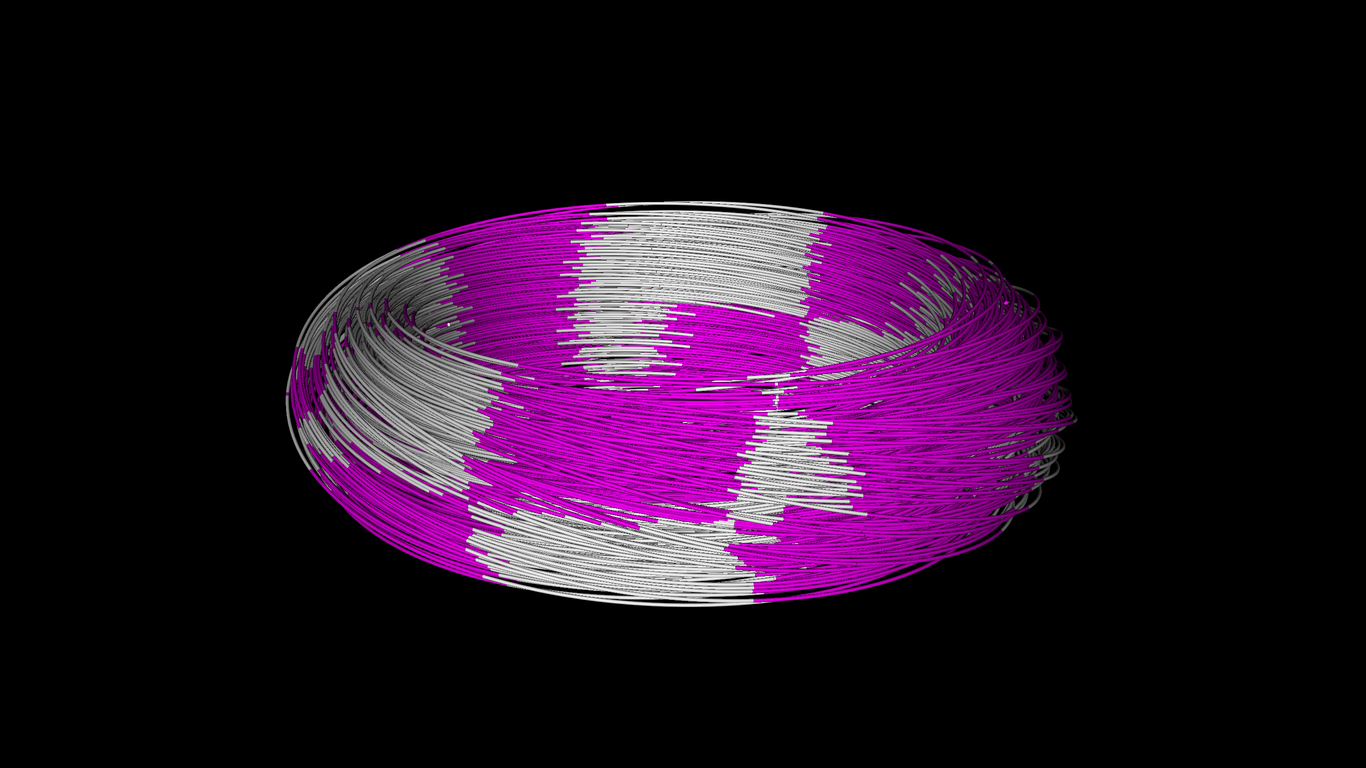
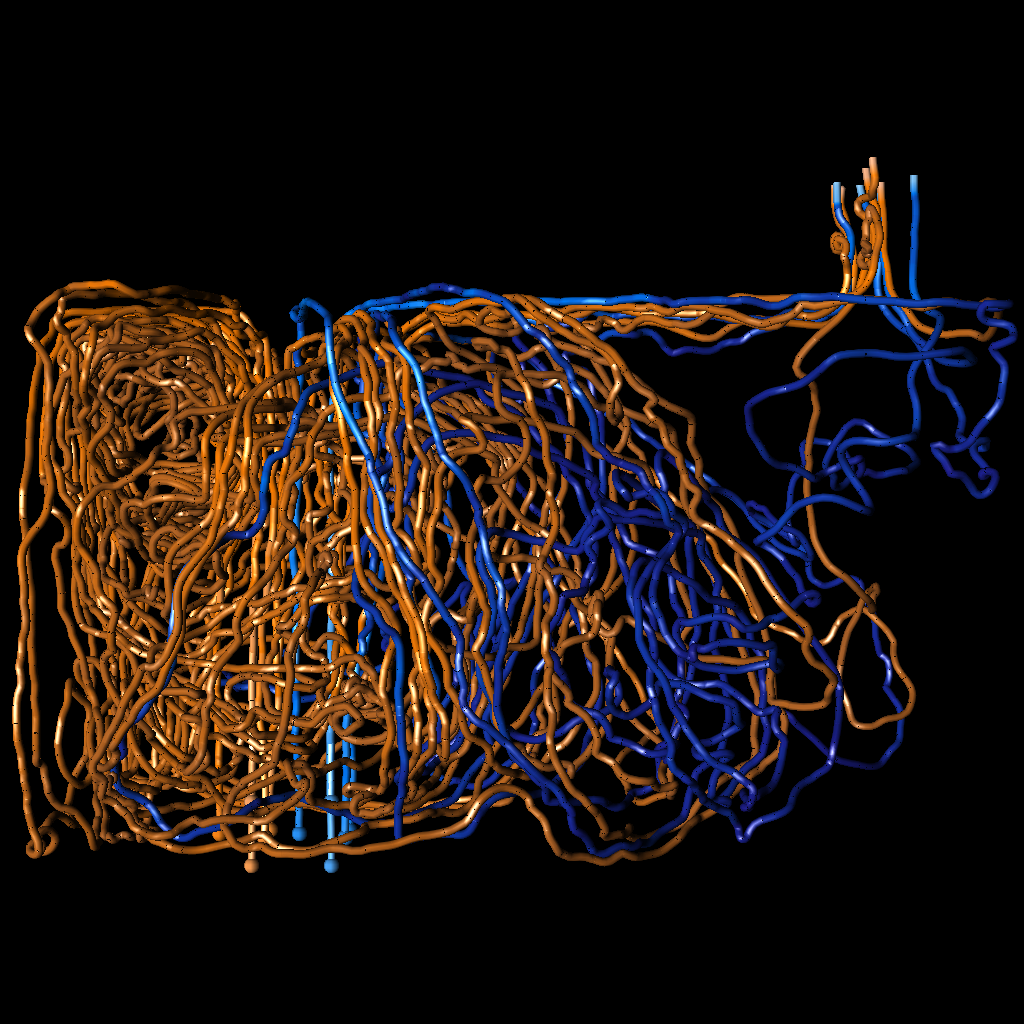
Fig 3. Randomly seeded streamlines after multiple revolutions around the tokamak. Streamlines are colored with a checkerboard scheme to show domain crossings. |
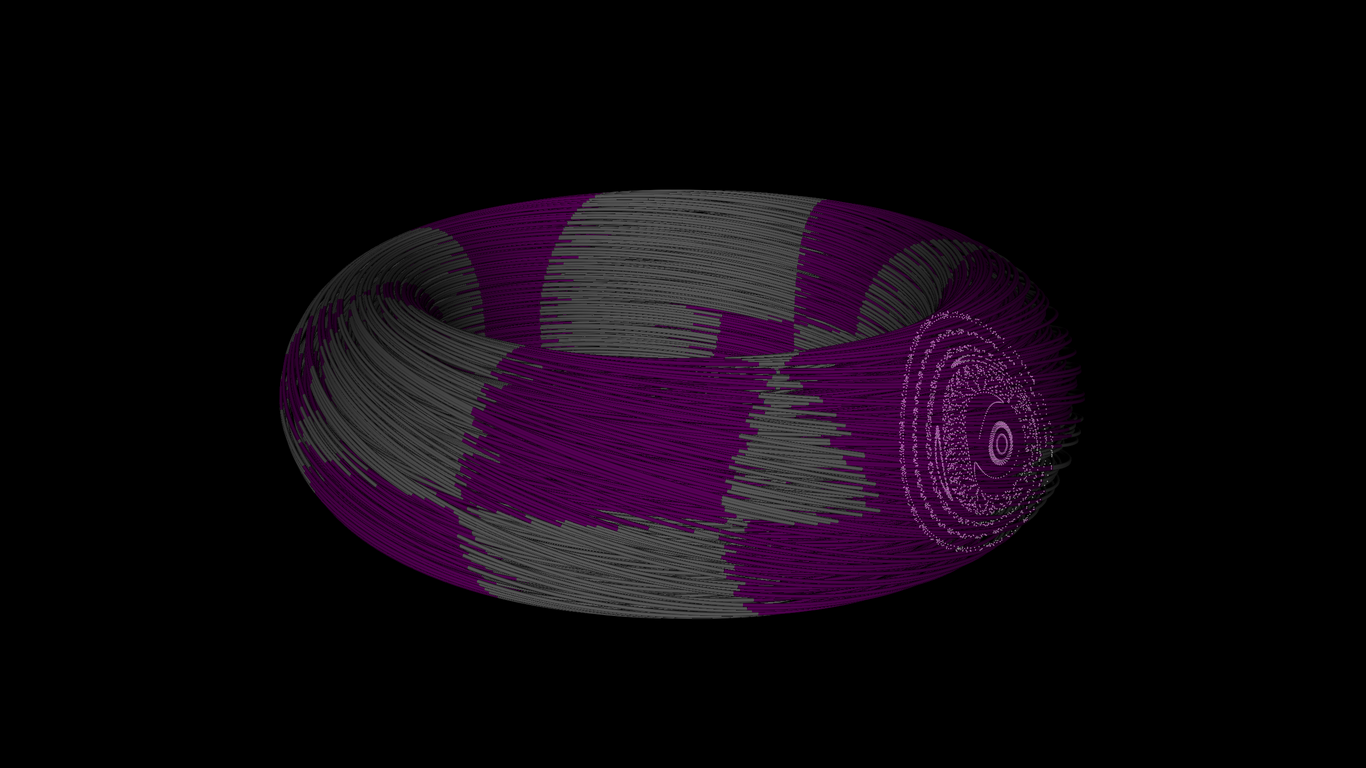
Fig 4. Poinacre plot of the randomly seeded streamlines from Fig 3. |
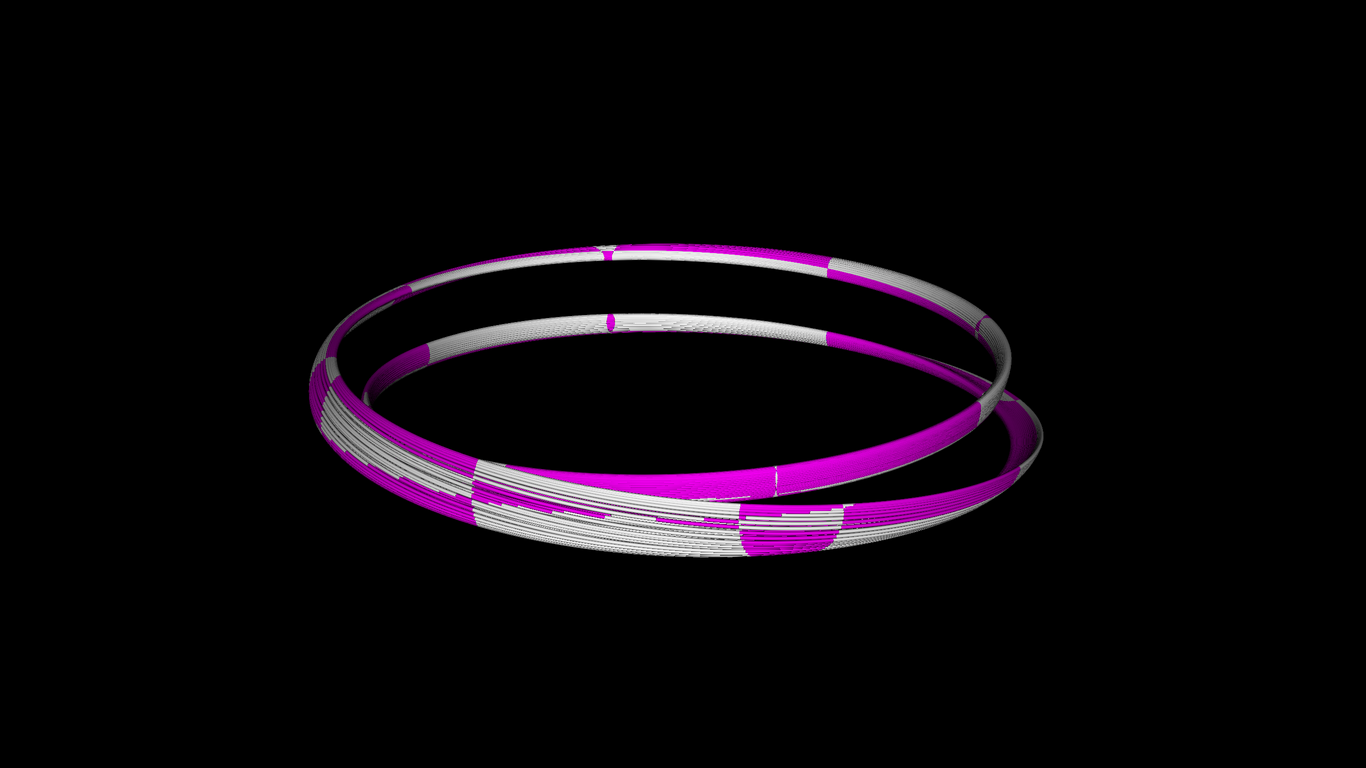
Fig 5. Using Poincare analysis the field lines of an island are identified and displayed. |
|||
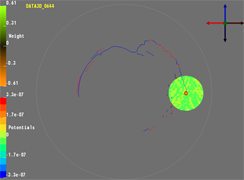
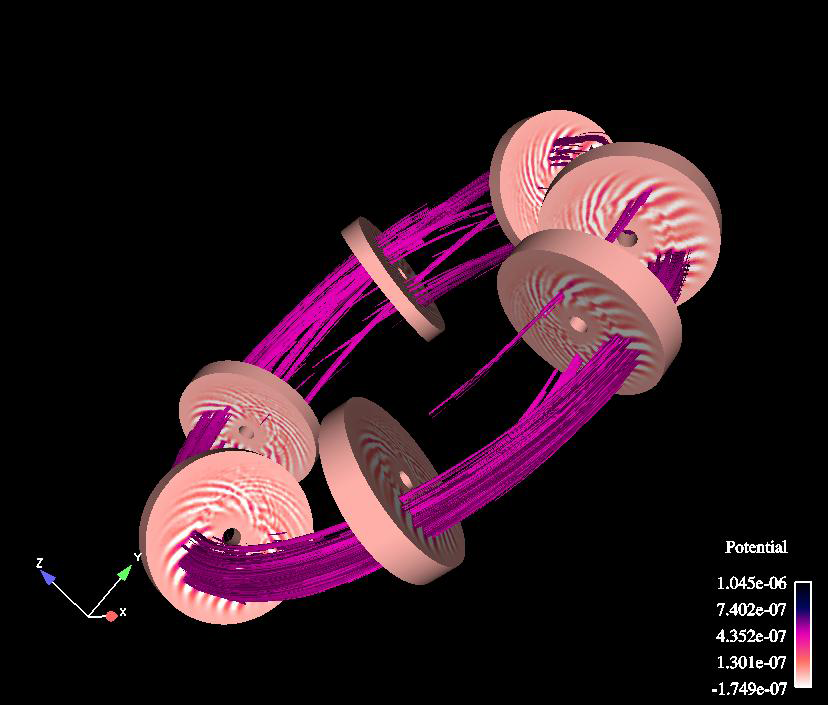
Gyrokinetic Particle Simulation for Magnetic Fusion Particle tracking visualization of a global, gyrokinetic 3D particle-in-cell simulation of plasma microtubulence in a tokamak toroidal fusion device. Only 22 of the 400 million particles in the simulation are being displayed based on the number of times that they get magnetically trapped (red line) and de-trapped (blue line) in relation to the externally imposed magnetic field. In the absence of turbulence, a trapped particle would remain trapped during the whole simulation and an untrapped particle would do likewise. In the video clip (fig 1) we show how the developing turbulence affects the trapping state and radial diffusion of the particles. The large circle following one of the particles displays the electrostatic potential around that particle. As the potential fluctuations increase due to the growing turbulence, the particle starts to interact with the wave through a different kind of trapping and detrapping process, resulting in a large radial diffusion, the amount of which is represented by the size of the particle. This simulation demonstrate the collision-less transport of particles, and thus energy, due to microturbulence. Although the particle trajectories are projected on a 2D cross-section for visualization purposes, the simulation itself is in 3D, (fig 2-4). It was carried out by Stephane Ethier of the Princeton Plasma Physics Laboratory using the Gyrokinetic Toroidal Code (GTC) (Z.Lin et al., Science 281, p.1835, 1998) on the Opteron-based system Jacquard at the National Energy Research Scientific Computing Center (NERSC). This work was performed under the DOE SciDAC Center for Gyrokinetic Particle Simulation of Turbulent Transport in Burning Plasmas. The visualization was produced by Allen Sanderson of the Scientific Computing and Imaging Institute under the DOE SciDAC Visualization and Analytics Center for Enabling Technologies (VACET). |
|||
Video Clip (43.5MB) |
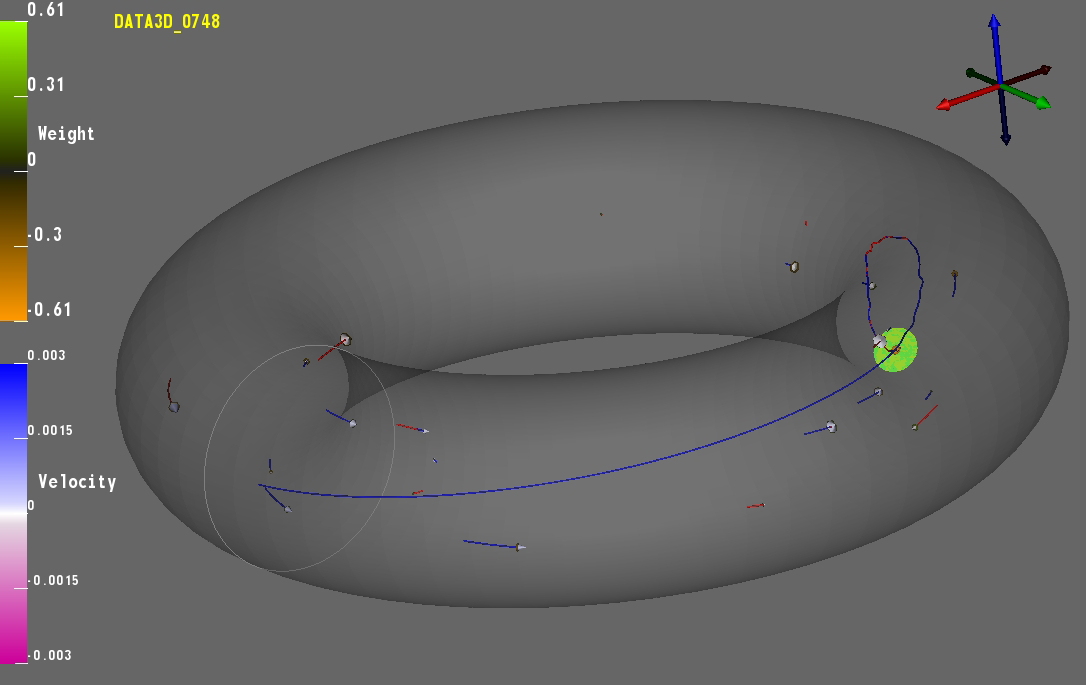
Fig 2. A 3D view of the simulation at the final time step. |

Fig 3. A combined view showing the relationship of the 3D and 2D views of the simulation at the final time step. |
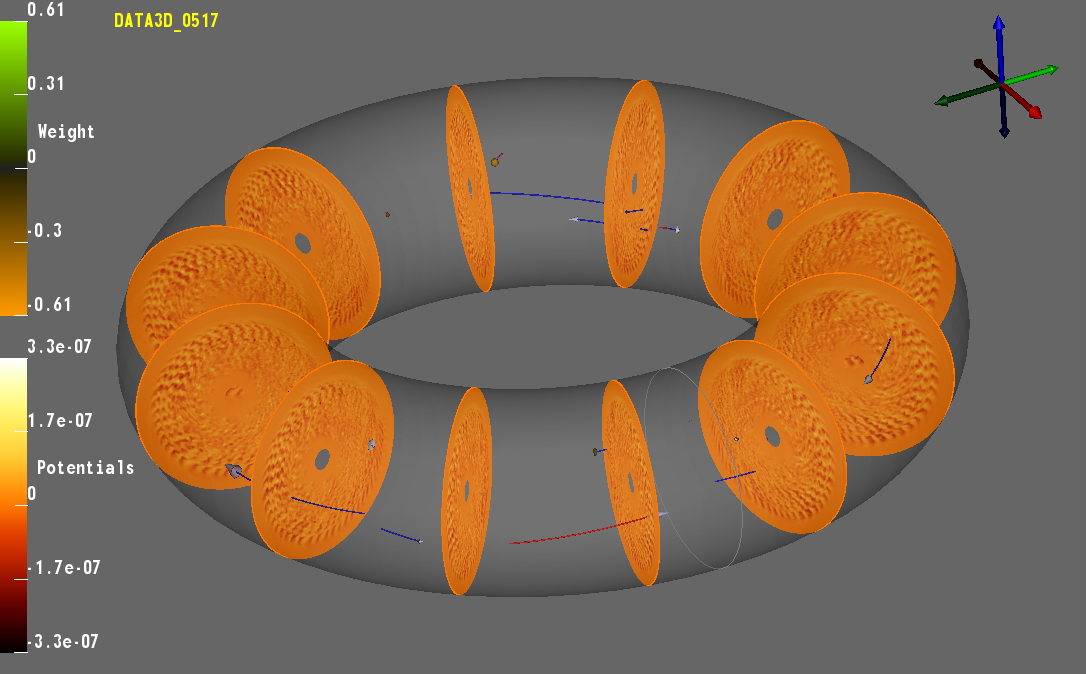
Fig 4. An intermediate time step from the simulation showing the particles as they move through the electric potential field. |
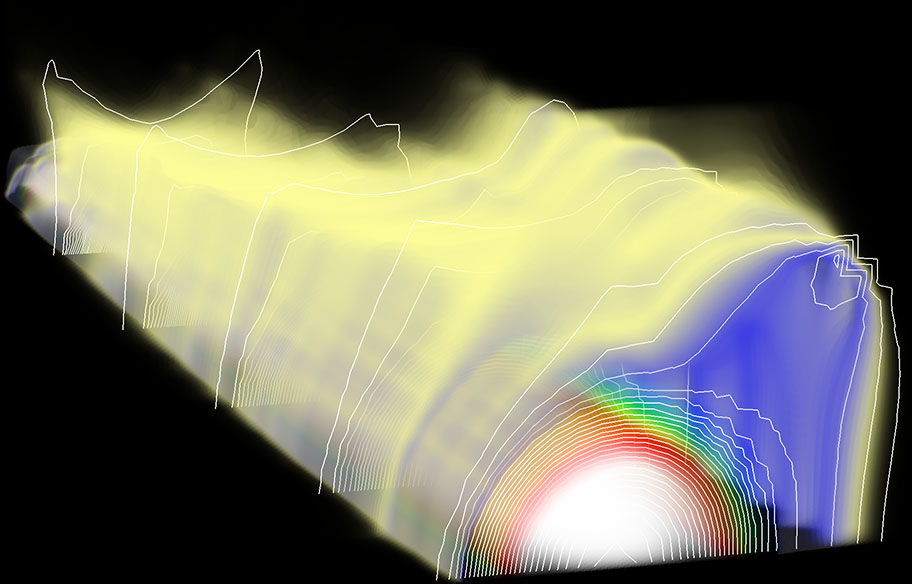
Visualization of the Magnetic Field and Plasma Temperature in D III-D Shot 87009 In many fusion simulation codes, the identification of instabilities in the plasma flow is critical to understanding the nature of tokamak experiment design. Because the plasma equilibrates much more rapidly parallel to the magnetic field lines than perpendicular to the magnetic field lines, visualizing the magnetic field topology is necessary to the understanding how the plasma energy is deposited on the material wall. The topology of the magnetic field is visualized using an analysis tool that produces a Poincar� map, Figure 1. Of particular interest in the analysis of the magnetic field topology is the break up of the magnetic flux surfaces into a series of island chains, Figure 2 which shows a 2:1 island chain that dominates the inner core of the simulation. As the field becomes more stochastic, the plasma will cool rapidly. This cooling is highlighted by a series of transparent iso-temperature surfaces, Figure 3. Though the temperature profile remains as a series on nested contours they have deformed based on the topology of the magnetic field. The complete evolution of the magnetic field and the subsequent plasma cooling is shown as a video, Figure 4. Simulation performed by Scott Kruger using the NIMROD code on the IBM SP RS/6000 computer at the National Energy Research Center. Visualization and Analysis performed by Allen Sanderson using the SCIRun Problem Solving Environment. Support provided by the DOE Scientific Discovery Through Advanced Computing (SciDAC) Project. |
|||
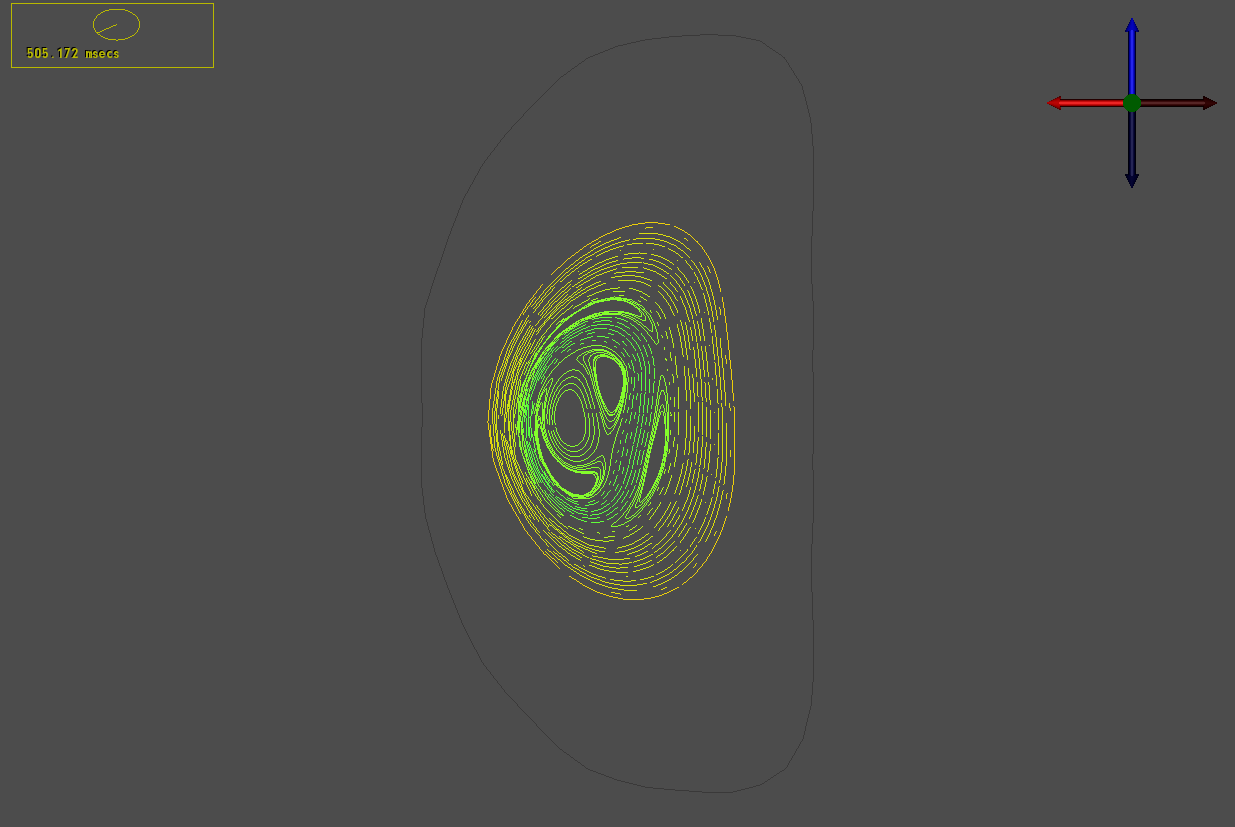
Figure 1. The topology of the magnetic field visualized using a Poincar� map. |
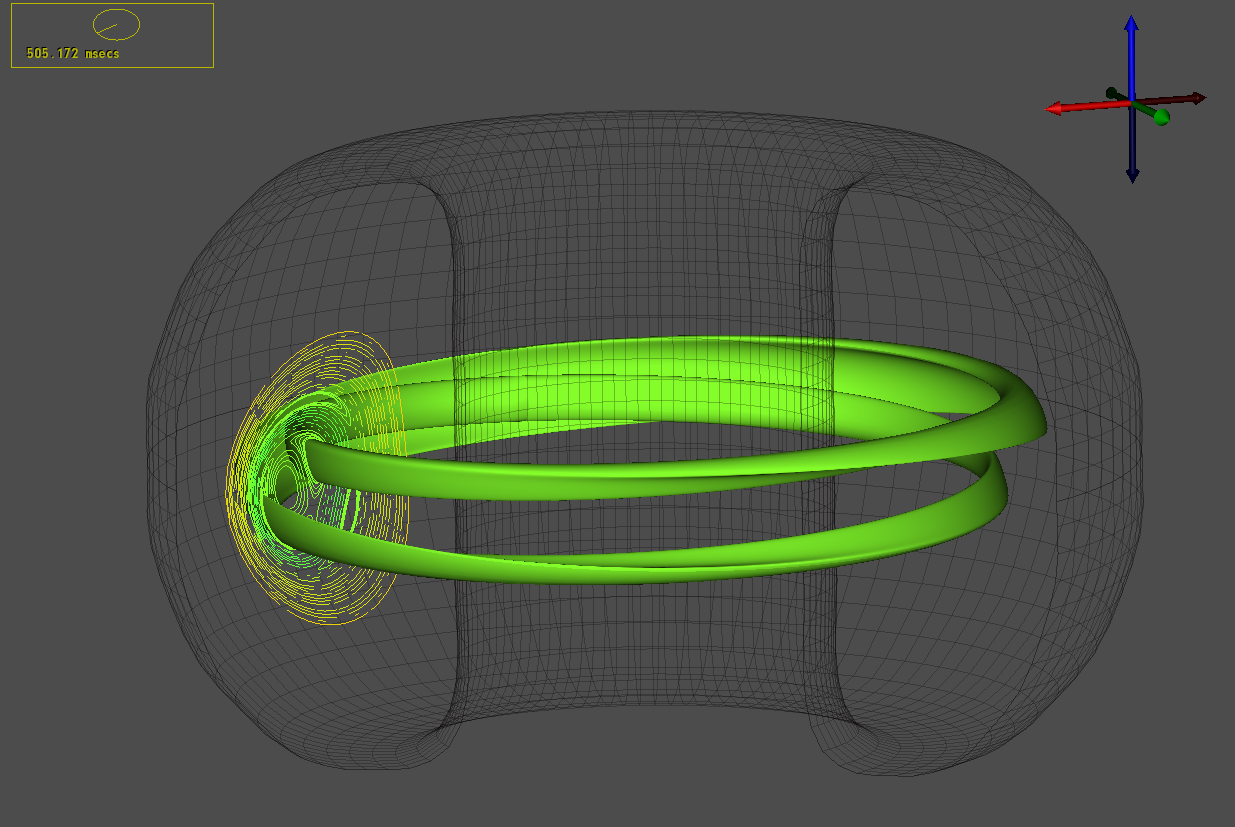
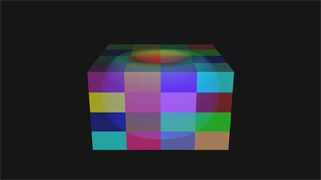
Figure 2. A visualization of a 2:1 magnetic island chain that dominates the inner core of the simulation. |
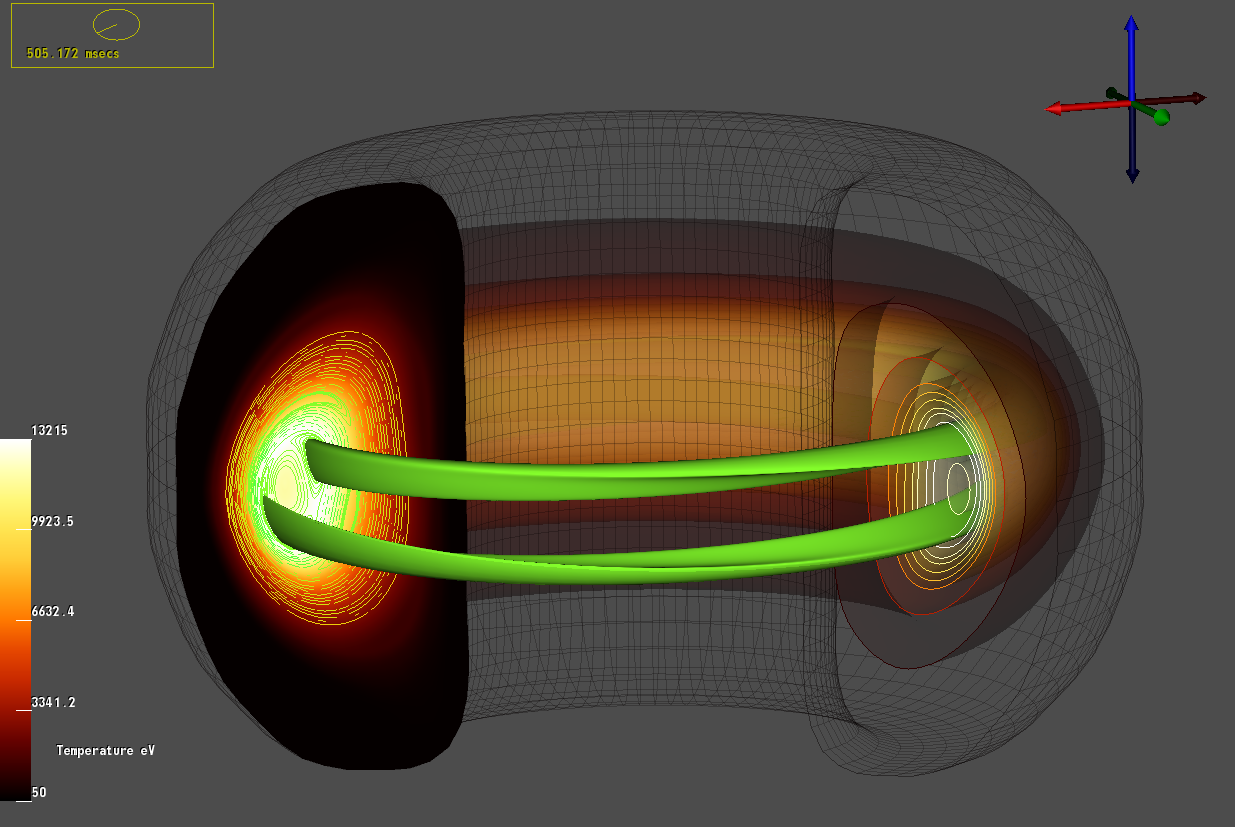
Figure 3. Same as Figure 2. but with in the inclusion of iso-temperature surfaces showing the affect of the magnetic field on the plasma. |
Figure 4. The complete evolution of the magnetic field and the subsequent plasma cooling. |
Other Images | |||

Image of a gyrokinetic particle using the GTC simulation code as it moves through the electrostatic potential that surrounds it. The particle interacts with the potential resulting in a large radial diffusion. By using a transparent rendering it is possible to see through the electrostatic potential at the same time the potential values near zero are removed which allows the structure of the mode waves with in the field to be seen. Data courtesy Stephane Ethier of the Princeton Plasma Physics Laboratory. |
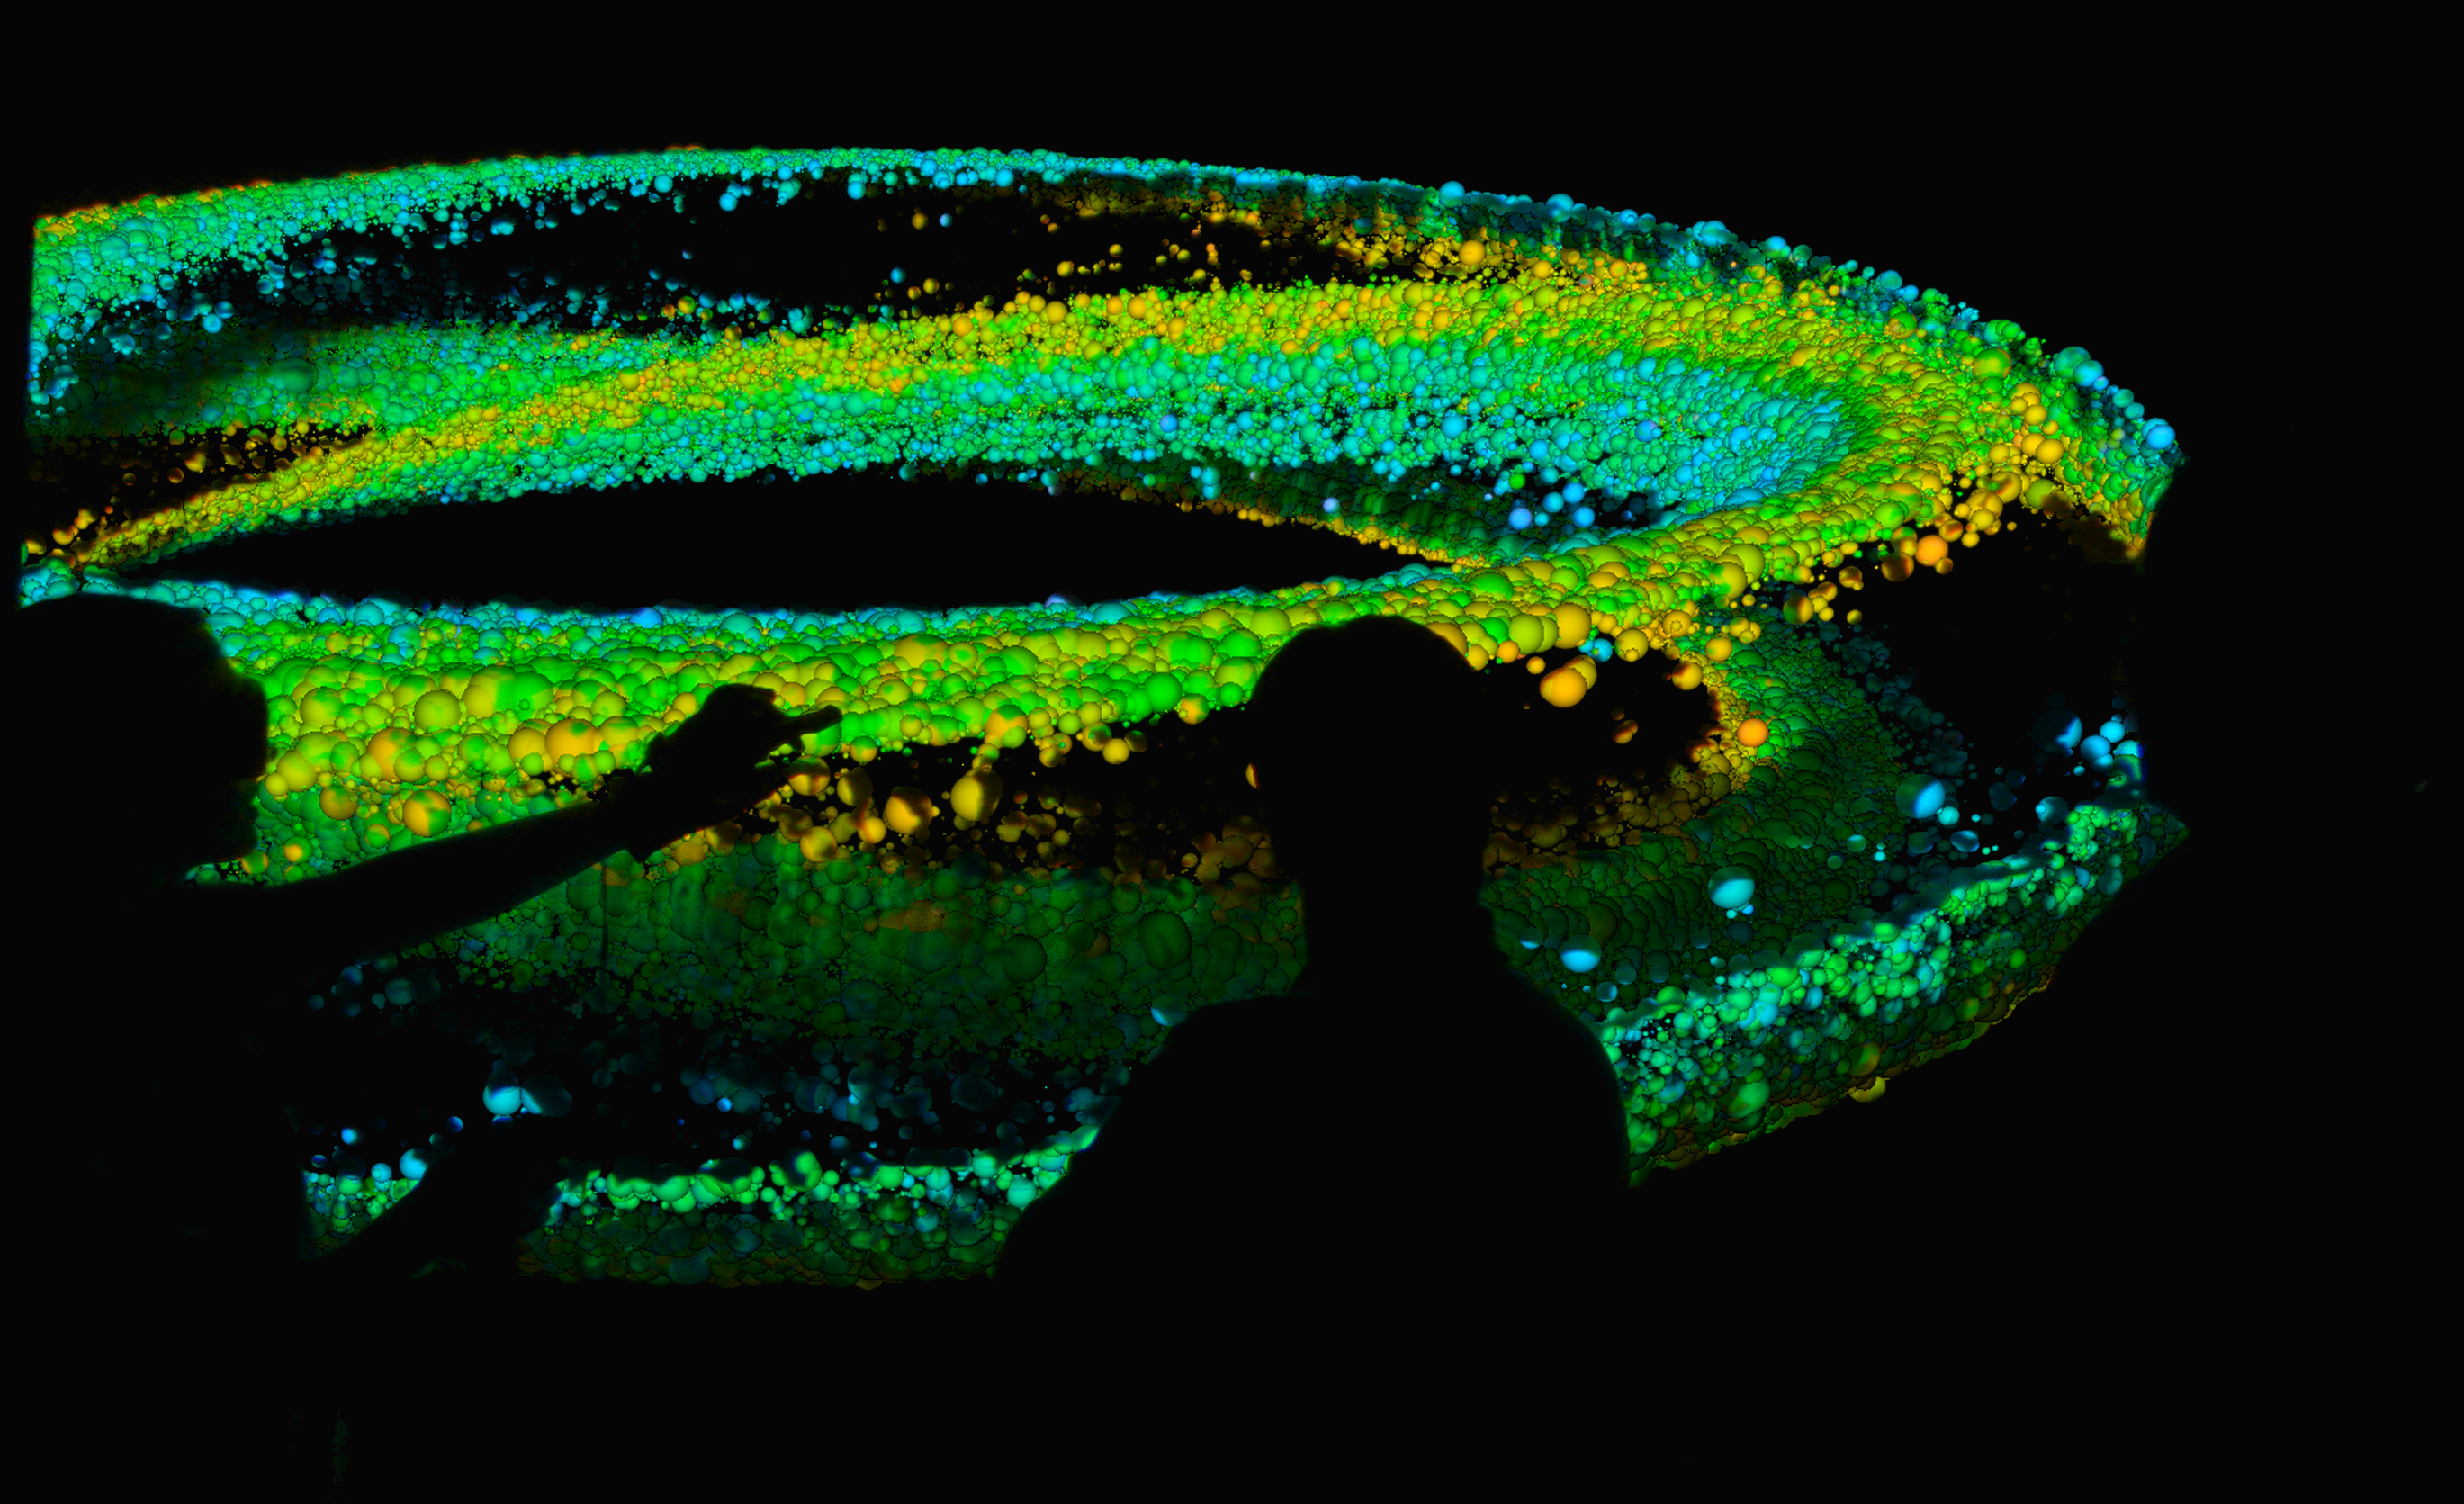
A visualization of gyrokinetic particles from a magnetic fusion simulation using the GTC simulation code. This visualization is displayed using the Manta ray-tracing system on the large display at the SCI Institute's Evans Visualization Center. Data courtesy Stephane Ethier of the Princeton Plasma Physics Laboratory. |
Simulation of DIII-D Shot #87009: Tokamak Plasma Simulation. Simulation performed using the NIMROD code. |
|
 |
 |
|
|
 |
|||