


Images & Movies
Software
VisIt
| Our functional performance experiments consist of loading extremely large data sets and executing visualization algorithms at extreme levels of concurrency producing images of isocontouring (below-fig 1) and volume rendering (below-fig 2). | ||||
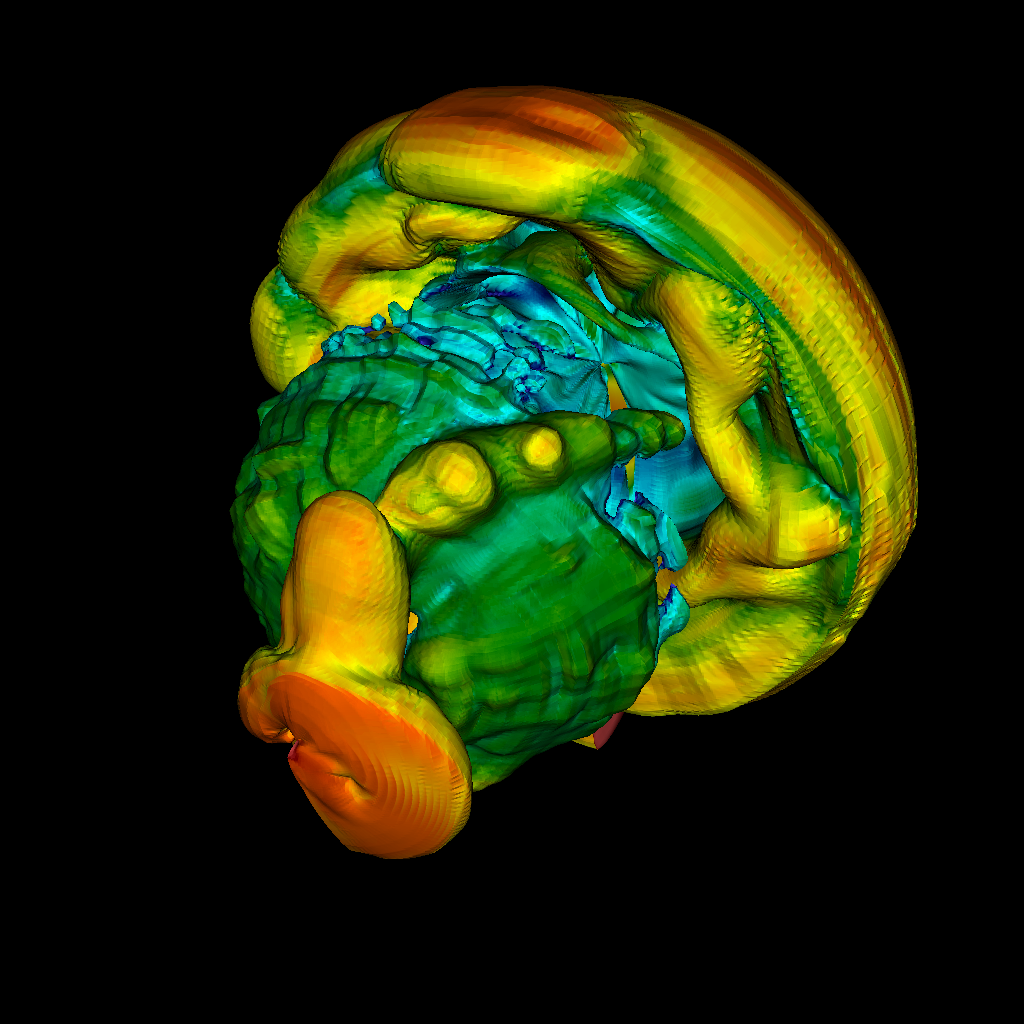 Fig 1. Isocontouring of two trillion zones on 32,000 Opteron cores of JaguarPF, a Cray XT5 at OLCF/ORNL. |
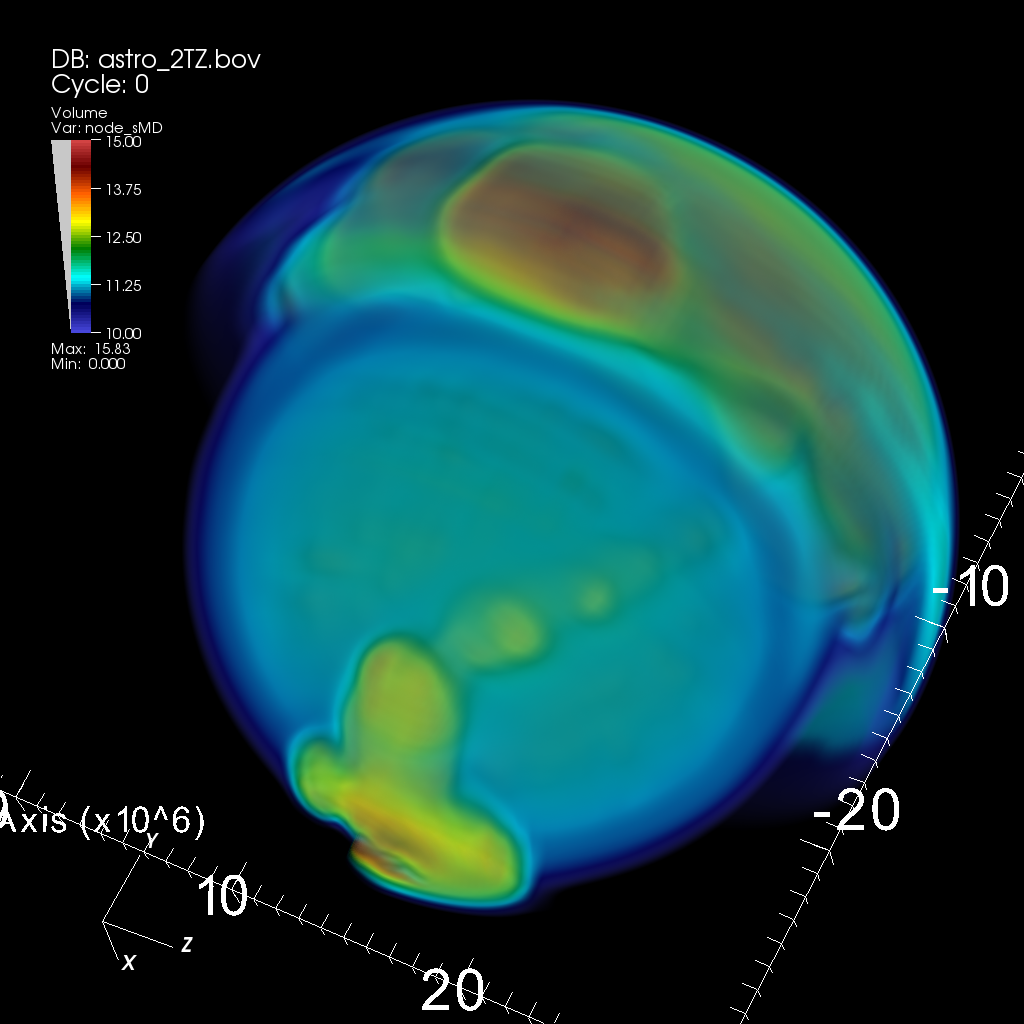 Fig 2. Volume rendering of two trillion zones on 32,000 Opteron cores of Franklin, a Cray XT4 at NERSC/LBNL. |
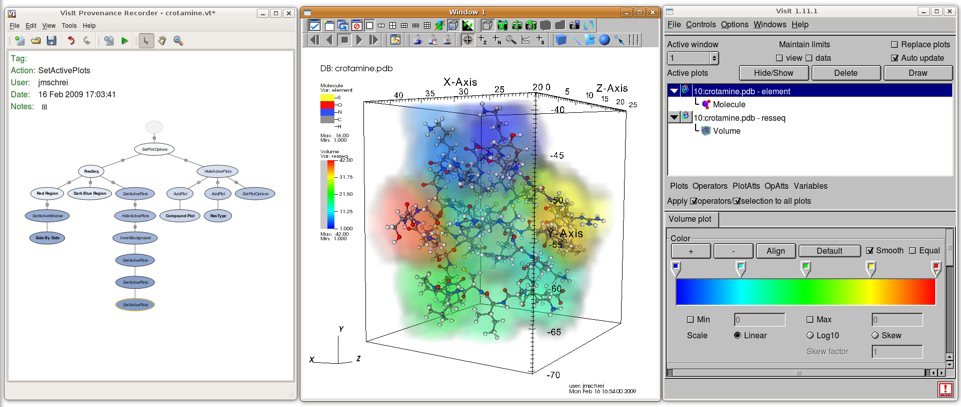 A screenshot of VisTrails plugin for VisIt working on Ubuntu/Linux. |
||
Tuvok using its "ClearView" rendering mode. ClearView suits the focus-and-context exploration model, common in large-scale scientific visualization, through an intuitive model of a lens which can see 'in' to the data set. In this data, scientists can rapidly discern the internal behavior of a Richtmyer-Meshkov simulation at the interface, while simultaneously viewing the global structure of the uids. |
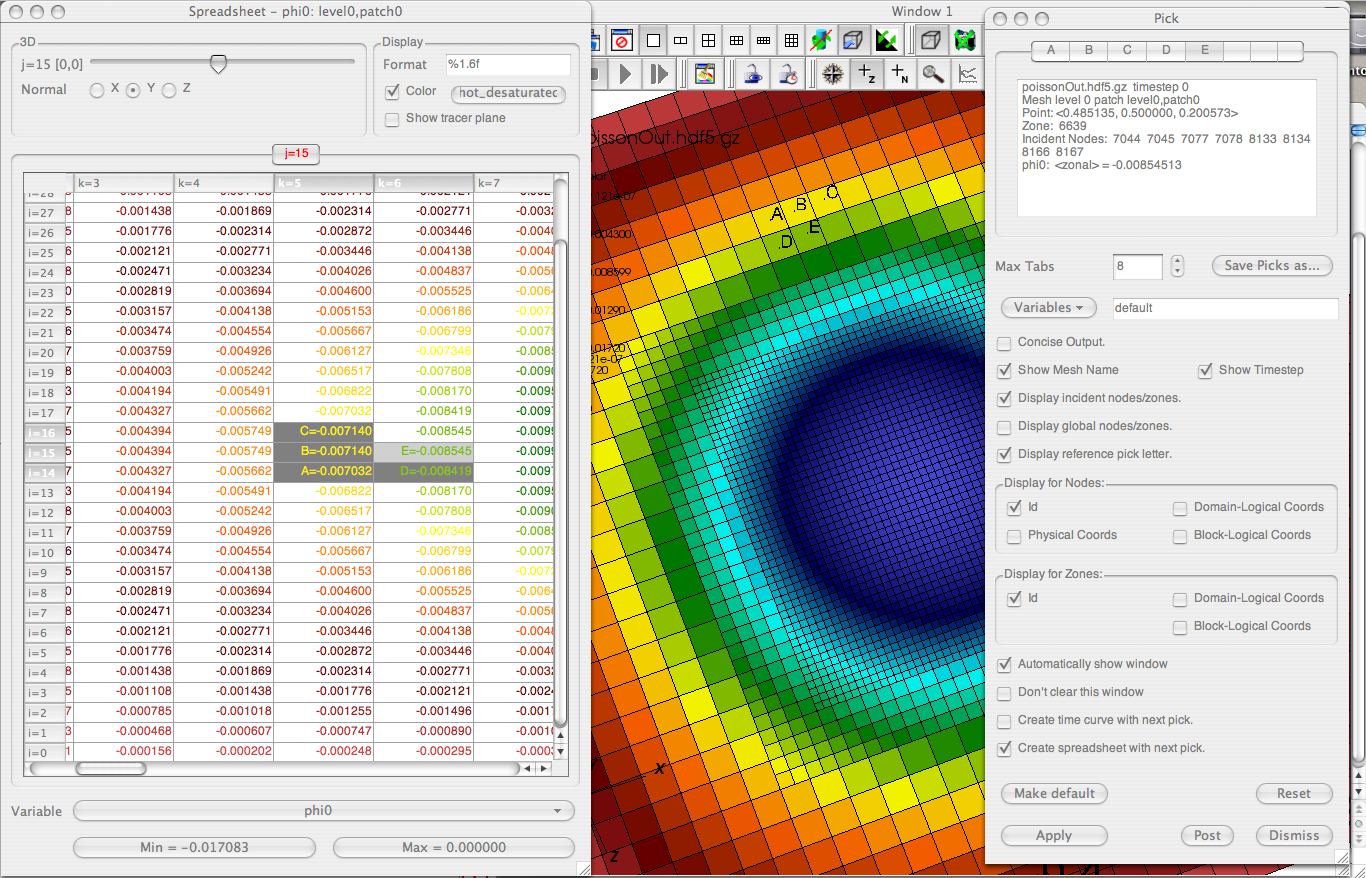
VisIt provides production-quality, parallel direct volume rendering of Adaptive Mesh Refinement data. This image shows a spreadsheet plot, which is used by AMR code development teams for debugging, and a corresponding slice through the 3D data sets. |
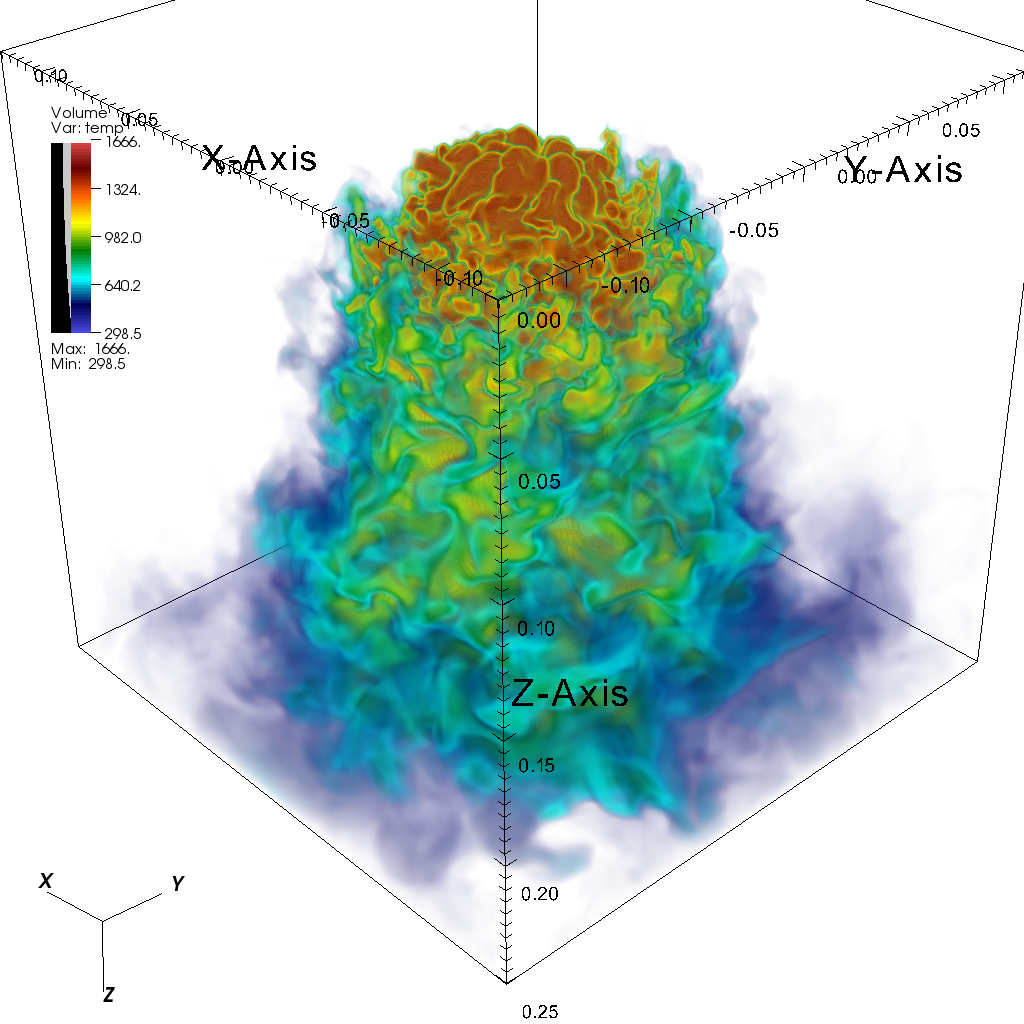
This image shows direct volume rendering of an AMR simulation of a hydrogen flame. |

VisIt provides production-quality, parallel-capable visual data analysis and exploration of Adaptive Mesh Refinement data. This image shows three orthogonal, psuedocolored slices of data from an AMR simulation of a hydrogen flame. |
|
VisTrails
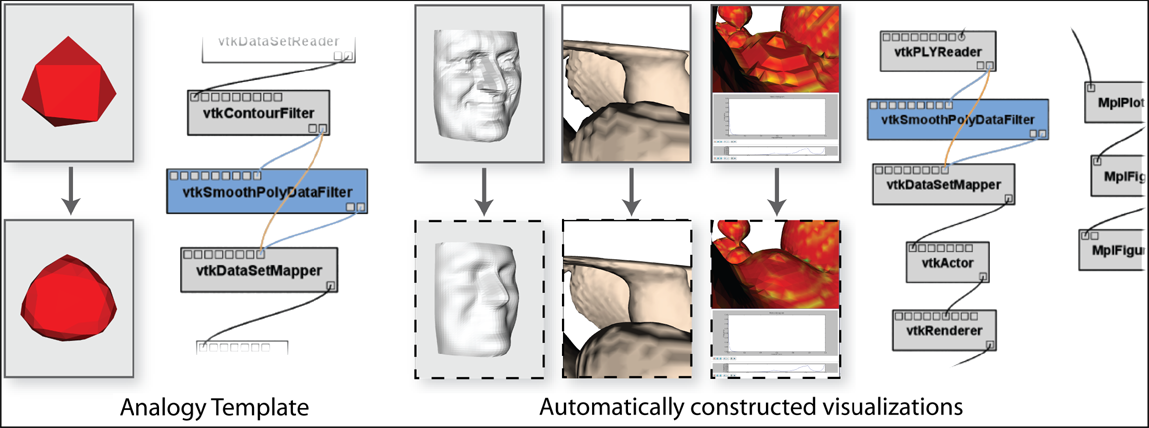
Visualization by analogy. The user chooses a pair of visualizations to serve as an analogy template. In this case, the pair represents a change where a file downloaded from the WWW is smoothed. Then, the user chooses a set of other visualizations that will be used to derive new
visualizations, with the same change. These new visualizations are derived automatically. The pipeline on the left reflects the original changes, and the one on the right reflects the changes when translated to the last visualization on the right. The pipeline pieces to be removed are portrayed in
orange, and the ones to be added, in blue. Note that the surrounding modules do not match exactly: the system figures out the most likely match. |

Interactive Visualization An example of a VisTrails pipeline used to create an interactive visualization within the spreadsheet of the visible human. An interactive cutting plane separates volume rendering and isosurfacing algorithms and is used to update orthogonal slices in separate windows. |
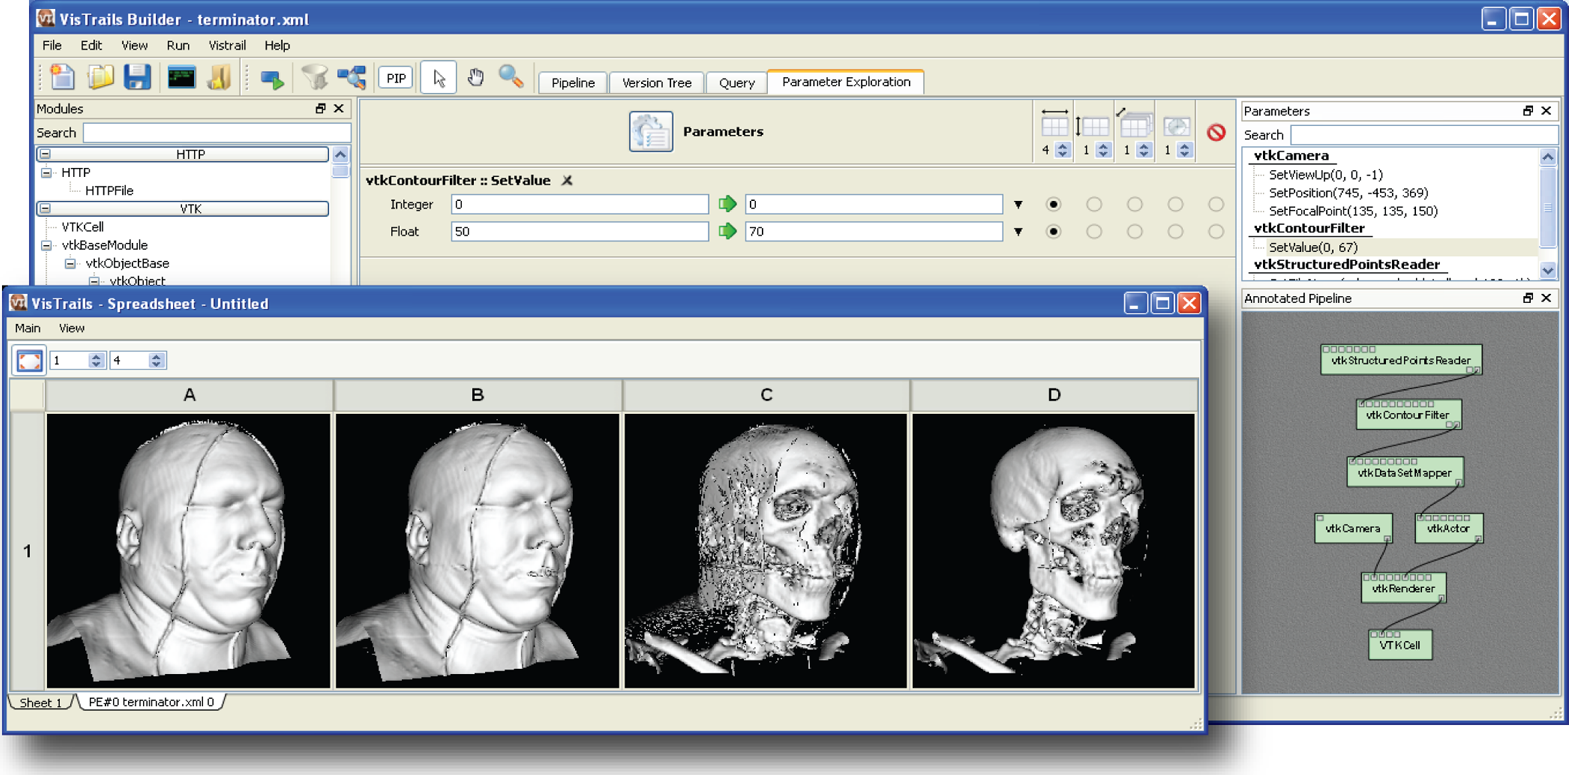
Parameter Exploration A snapshot of the parameter exploration interface for a simple one-dimensional exploration of isosurface values in the visible human. |

Mesh Comparison An example of exploratory visualization for comparing isosurface extraction techniques using VisTrails. Complete provenance of the creation and exploration process is displayed in a history tree on the left. One pipeline that combines five different software libraries is shown in the middle. A parameter exploration of this pipeline for three different datasets and isosurface parameters is shown in the Visualization Spreadsheet on the right. |