About CIBC
Vis Tools and Techniques
Application Areas
Collaborations
Software/Datasets
Images/Movies
Publications
Contact
Links

DOE SciDAC Visualization and Analytics Center for Enabling Technologies (VACET)

DOE SciDAC Visualization and Analytics Center for Enabling Technologies (VACET)
Scientific Computing and Imaging Institute Institute for Data Analysis and Visualization Lawrence Livermore National Laboratory Oak Ridge National Laboratory Lawrence Berkeley National Laboratory
Home > Application Areas > Astrophysics

Astrophysics

Understanding the explosive nature of stellar supernovae and the subsequent production of elements is one of the more challenging problems undertaken by SciDAC. The set of astrophysics efforts supported by SciDAC and VACET range from modeling supernova explosions to cosmology and early universe formation. The computational astrophysics projects produce very large, multi-field, time-varying data at DOE's open computing facilities. SciDAC2 will begin to include efforts that aim to compare the results of simulations with supernova spectrum and cosmic microwave background radiation observations.

To meet their data understanding needs, these groups need:

  1. visualization tools capable of displaying data on AMR grids that have tremendous spatial and temporal scale - from galactic to subplanetary;
  2. new visualization techniques for effective display of radiation flux data containing both space and energy as independent variables;
  3. new grid types (so-called "yin-yang" grids that eliminate singularities at the poles and maintain a relatively uniform sampling frequency across the computational domain);
  4. feature identification and tracking over time, along with the ability to perform visual analysis of temporally varying features;
  5. the ability to perform feature mining and visual correlation by selecting regions of spectrum synthesis data and displaying/analyzing the portions of the models containing that spectrum;
  6. effective remote visualization capability;
  7. transparent access to distributed data;
  8. simultaneous display of particle- and field-based data;
  9. the ability to perform simulation-simulation and simulation-observation comparative visualization and analysis.

Achieving these objectives will require a multi-year, coordinated effort that leverages the best current and new capabilities from visualization and scientific data management.

See Gallery: Astrophysics


Volume plot of the logarithm of gas/dust density in an Enzo star and galaxy simulation. Visualization created with VisIt.
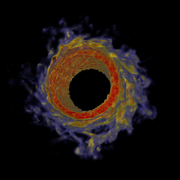

Visualization of Magneto-rotational instability and turbulent angular momentum transport from a simulation of matter in a swirling disk surrounding an attracting central object analogous to a newly formed star. The presence of magnetic fields can cause the disk to become unstable and develop turbulence, thereby causing the disk material to fall onto the central object.