About CIBC
Vis Tools and Techniques
Application Areas
Collaborations
Software/Datasets
Images/Movies
Publications
Contact
Links

DOE SciDAC Visualization and Analytics Center for Enabling Technologies (VACET)

DOE SciDAC Visualization and Analytics Center for Enabling Technologies (VACET)
Scientific Computing and Imaging Institute Institute for Data Analysis and Visualization Lawrence Livermore National Laboratory Oak Ridge National Laboratory Lawrence Berkeley National Laboratory
Home > Visualization Tools & Techniques > Temporal Visualization & Analysis

Temporal Visualization and Analysis

Temporal visualization and analysis refers to the process of looking at or analyzing features or data that are dependant variables where time is an independent variable. It can take many different forms: reconstruction of the spatial path a feature travels over time, rate of change of velocity, size or other data/factors over time, and absolute change in data fields or features over time. Some specific projects we will undertake:

  1. given a collection of datapoints (a parcel of fluid in a combustion model), compute and display statistical moments of a number of simulation fields in an "EKG-style" plot;
  2. for an accelerator modeling stakeholder, detect and display particles that "are lost" as they leave the beamline and strike the accelerator walls;
  3. accumulate and display statistics about those lost particles (statistical distribution of electrostatic potential and velocity);
  4. compute the spatial and temporal distribution of ignition kernels in a combustion simulation; and
  5. provide the infrastructure to detect and track hurricanes in climate models, and to perform feature mining to help understand the relationship between atmospheric and ocean temperatures and the frequency and magnitude of hurricanes.


Video Clip (4.8MB)

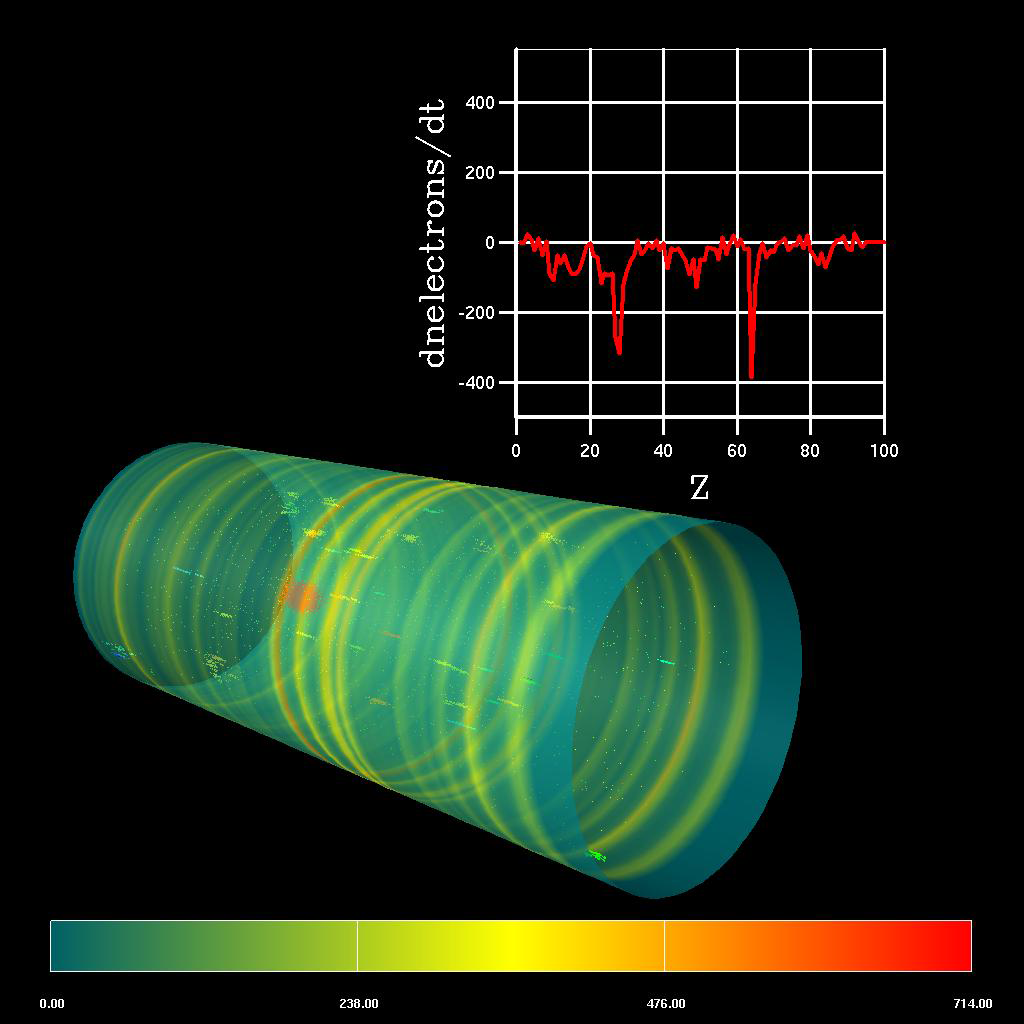
This image shows a proton beam moving along the beam pipe (z-axis) in the presence of an electron cloud. The proton beam is shown in red in the center of the pipe. A. Adelmann, PSI.