


Uncertainty Visualization With few exceptions, visualization research has ignored the visual representation of errors and uncertainty for three-dimensional visualizations. This lack can be attributed in part to the inherent difficulty in defining, characterizing, and controlling comparisons between different data sets and in part to the corresponding error and uncertainty in the experimental, simulation, and/or visualization processes. In addition, visualization researchers have developed few methods that allow for easy comparison and representation of error and uncertainty in data for visualizations. To make current and proposed visualization and analytics techniques and software more useful to SciDAC researchers, we propose to incorporate visual representations of error and uncertainty within a set of the most often used visualization techniques for scalar, vector, and tensor fields. In some cases this could be as simple (but virtually non-existent in most visualization techniques and software) as adding to an existing display some indication of the level of statistical error that is present in the data. We would also leverage our work in comparative visualization to allow the ability to overlay and compare two-dimensional and three-dimensional visualizations and uncertainty (automating the so called "view-graph norm"). Additionally, we will explore better visual representation of, and interaction with, statistical data within three-dimensional visualizations and leverage existing work in information visualization and analytics methods applied to three-dimensional scientific visualization data. Finally, we would leverage our latest research in statistically quantitative methods for volume visualization techniques to adapt and deploy these new methods for SciDAC applications. |
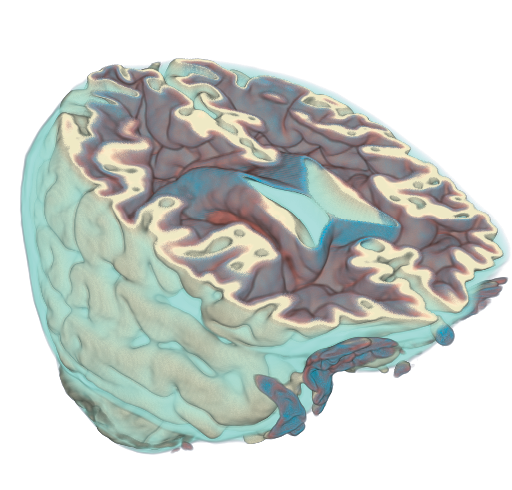 This Volume visualization is based on T1 MRI scans of a human head and shows "fuzzy" classified whitematter, gray-matter, and cerebro-spinal fluid. It demonstrates a visualization technique that allows users to interactively explore the uncertainty, risk, and probabilistic decision of surface boundaries. Our approach makes it possible to directly visualize the combined "fuzzy" classification results from multiple segmentations by combining these data into a unified probabilistic data space. |