


Fusion Understanding the complex behavior of magnetically confined fusion plasmas is an important goal of DOE's many fusion projects. The fusion community uses many different simulations to model the effects of physical and electromagnetic phenomena that contribute to plasma stability and effective plasma containment. These phenomena include radio frequency heating, stellerator and tokamak geometries, magnetic field evolution, and eddy stability. The fusion community has made an investment in visualization capabilities resulting in capabilities for producing compelling imagery. Despite that investment and prior work, our stakeholders have clearly stated they need visualization tools that provide the ability to test hypotheses in a visual environment, and that can process the large data being produced now and in the future on DOE's large open computing facilities. As one notable fusion scientist at ORNL put it, "If we knew what we were looking for, we'd just go make a picture of it." Through our discussions with the Fusion community the overarching need is for tools that fuse analytical techniques with visualization. VACET will address the needs through tools with:
See Gallery: Fusion |
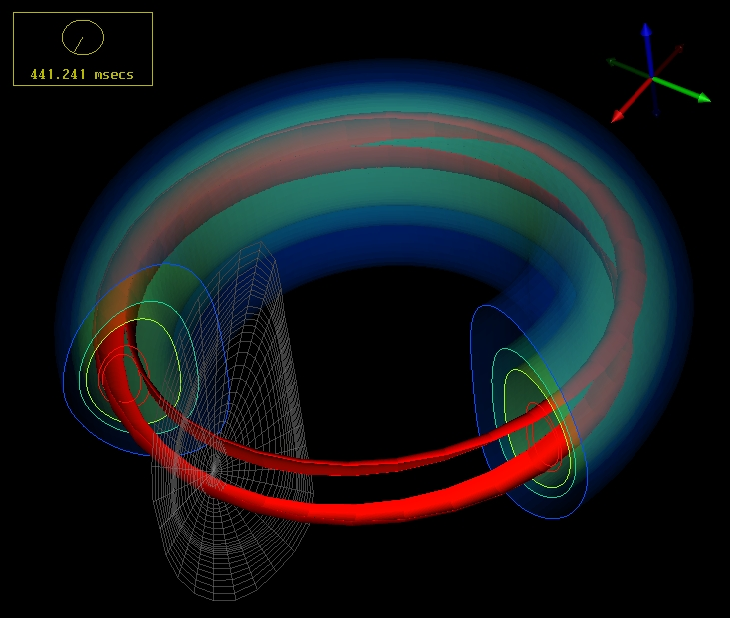 Topological analysis of magnetic islands from a NIMROD simulation of tearing modes started from an equilibrium fit of laboratory data from the DIID-D Tokamak that produced a reversed-shear discharge. This visualization was done using the SCIRun/Fusion PSE. |