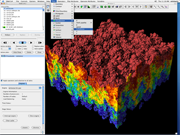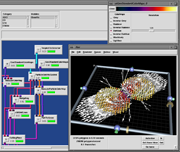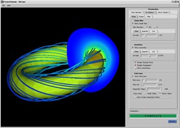


Project-Wide Visualization Tools A "project-wide" visualization tool is an application that is used by all members of a particular project or community. This increases scientific efficiency in several ways: reducing the complexity of maintaining many different software packages, maximizing the opportunity to accumulate and share knowledge about using a particular application, reducing the learning curve associated with the introduction of unfamiliar tools, and helping a particular community to establish and maintain "standard" ways of visual data analysis. This type of interface is sometimes referred to as a "dashboard" - where the controls and displays are tailored for a particular scientific endeavor. Several of our current science stakeholders have requested this type of capability (astrophysics, accelerator modeling, and environmental remediation). VACET focuses on:
These activities will be ongoing over the course of the project, and our overall organization facilitates such an evolutionary approach. In terms of software engineering, both of our primary delivery vehicles - VisIt and SCIRun - support exactly this type of programmatic use. Furthermore, our overall software design and engineering strategy - algorithms and libraries, frameworks and components, fully featured visualization applications - exactly reflects this approach. This approach has proven to be low-risk and highly effective as evidenced by domain-specific applications produced by team members in the past: FusionView as a derivative of SCIRun; an explosion modeling application in use at LLNL as a derivative of VisIt. |


