

News & Events 2007
VACET Fusion Visualization Research Profiled on NJN News
SciDAC Features VACET Research: Topological Analysis Provides Deeper Insight into Hydrodynamic Instabilities
VACET Article: "Strategy for Petascale Visual Data Analysis Success" features in the Nov 2007 CTWatch Quarterly e-zine
VACET VisTrails Team Wins Best Paper at Vis 2007
The paper "Querying and Creating Visualizations by Analogy", by Carlos E. Scheidegger, Huy T. Vo, David Koop, Juliana Freire, and Cl�udio Silva was selected as the "Best Paper" at IEEE Visualization 2007. In this paper, the authors introduce a new framework that allows users who are not necessarily programmers to query and refine pipelines (or workflows) by analogy. They describe a query-by-example interface which allows users to construct as complex, structure-based queries (e.g., find workflows that resample a data set before extracting an isurface) by example, using the same interface used to build pipelines. They also introduce analogy as a first-class operation to create and refine pipelines. The analogy operation allows casual users to modify pipelines without having to directly edit their definitions. These features have been implemented in their open-source workflow and provenance management system called VisTrails, which can be downloaded from the SCI Website. For more information see:
Feature Story: Announcing VisTrails 1.0!
C. Scheidegger, H. Vo, D. Koop, J. Freire, C.T. Silva. "Querying and Creating Visualizations by Analogy," In IEEE Transactions on Visualization and Computer Graphics 2007, pp. 1560--1567. 2007.
Versions Available: [ PDF ]
Announcing VisTrails 1.0! (pdf)
VisTrails Integrated with CDAT
Starting with Version 5.0 of Climate Data Analysis Tools (CDAT), VisTrails, a scientific workflow management system developed by VACET teem members at the University of Utah, will be integrated to provide workflow management to the system. CDAT, is an open source and free application developed by the Program for Climate Model Diagnosis and Intercomparison (PCMDI) for visualization and analysis of climate data. Like other Problem Solving Environments, CDAT uses networks of modules, or workflows, to create a desired visualization. VisTrails provides an interface for managing many workflows and comparing the results of each solution side by side. VisTrails also provides provenance for each workflow making it easy to retrace the development of a workflow or return it to a previous version.
For more information about the integration of VisTrails with CDAT, see the CDAT Newsletter.
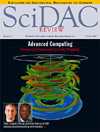
VACET Image Featured on Cover of Spring SciDAC Review
 A beautiful visualization of magnetically unstable cylindrical Couette flow is featured on the cover of the Spring 2007 issue of SciDAC Review. Several other VACET images are also featured in this issue and VACET is profiled in an article about the new SciDAC-2 projects. The cover image was created by Cristina Siegerist of LBNL in a collaborative effort between VACET and the NERSC Analytics program (www.nersc.gov) as part of DOE's INCITE program.