


Images & Movies
Climate
 Hurricane Season (Video Clip 38MB)Prabhat (LBL), Michael Wehner (LBL), Wes Bethel (LBL) ** SciDAC 2010 VisNight Winner! ** |
|||||
|
|

|
|||
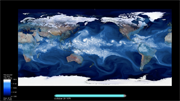
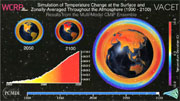
This animated series of temperature anomaly maps was produced by averaging results from 15 of the most advanced climate models in the world. Simulation of historical and projected climate data shows a strong warming trend in the lower atmosphere, underneath a cooling layer in the upper atmosphere. The model results shown in this video were contributed by participants in the World Climate Research Programme's Climate Model Intercomparison Project (CMIP) and were archived by the U.S. Departement of Energy's Program for Climate Model Diagnosis and Intercomparison (PCMDI) at Lawrence Livermore National Laboratory. The data was analyzed using the Climate Data Analysis Tools developed by PCMDI. The visualization was produced with the integrated ViSUS tools developed by VACET. Peer-Timo Bremmer, Charles Doutriaux, Valerio Pascucci, and Dean N. Williams were responsible for most aspects of data analysis, graphics rendering, and movie production. |
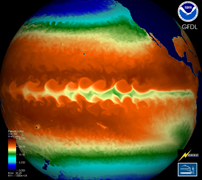
(Above) We present results from a collaboration between NERSC Analytics and GFDL/NOAA. We developed modules to load the next-generation GFDL/NOAA climate models; which include a cm2.4 tri-polar mesh and the c180 cube-sphere mesh in VisIt. Simulations were run on a Cray XT4 system at NERSC. The high-resolution models offer not only a closer look at physical elements of the climate, such as tropical storms, but they also enable researchers to conduct a more in-depth analysis of climate change as higher-resolution phenomena in the ocean and atmosphere are resolved. - Prabhat, J. Jacobsen, G.H. Weber, C. Kerr, V. Balaji and E.W. Bethel (Lawrence Berkeley National Laboratory) Note: Winner of "People's Choice" award at SciDAC 2008. |
||||
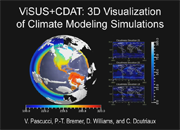
ViSUS+CDAT: 3D Visualization of Climate Modeling Simulations. V. Pascucci, P.-T. Bremer, D. Wiliams, and C. Doutriaux. |
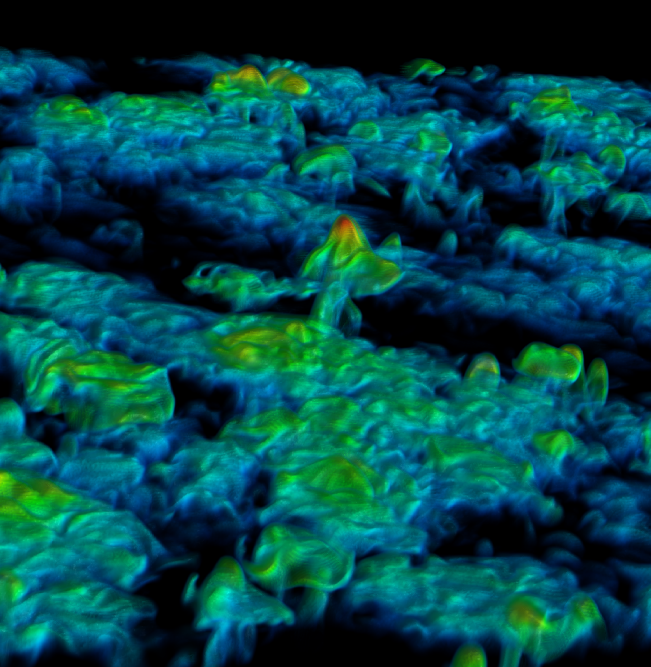
Volume visualization from a weather simulation. Images shows a condensed water field 1008x1008x300. UCRL-JC-145931 Effects of Domain Size and Numerical Resolution on the Simulation of Shallow Cumulus Convection. David E. Stevens (LLNL), Andrew S. Ackerman (NASA AMES), and Christopher S. Bretherton (UW, Seattle) |

The image shows the component of the atmospheric CO2 concentration
that results from the net ecosystem exchange (NEE), which is shown on
the land surface. This "green CO2" is the flux due to the
respiration of vegetation, respiration of soil microbes, and fire minus
that taken up by ecosystem production. |
|||
 |
 |
 |
 |
||
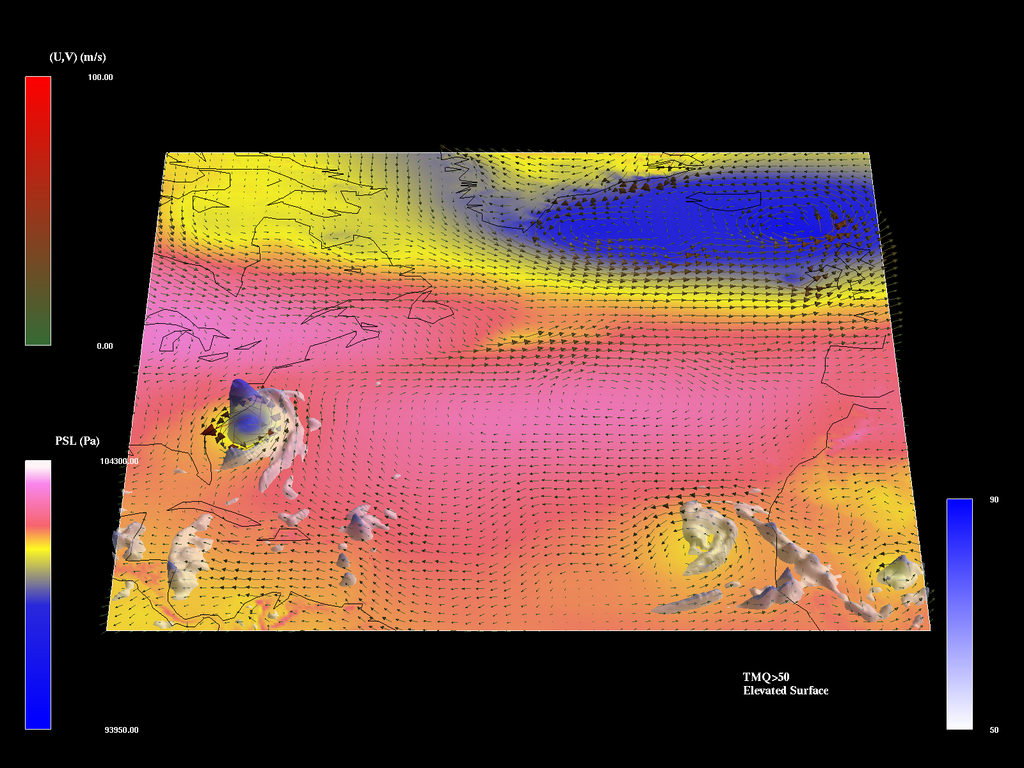
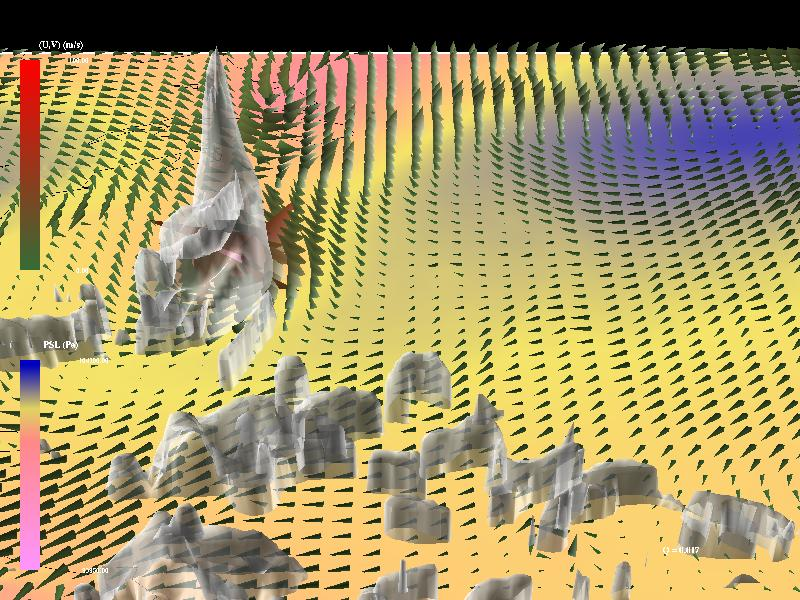
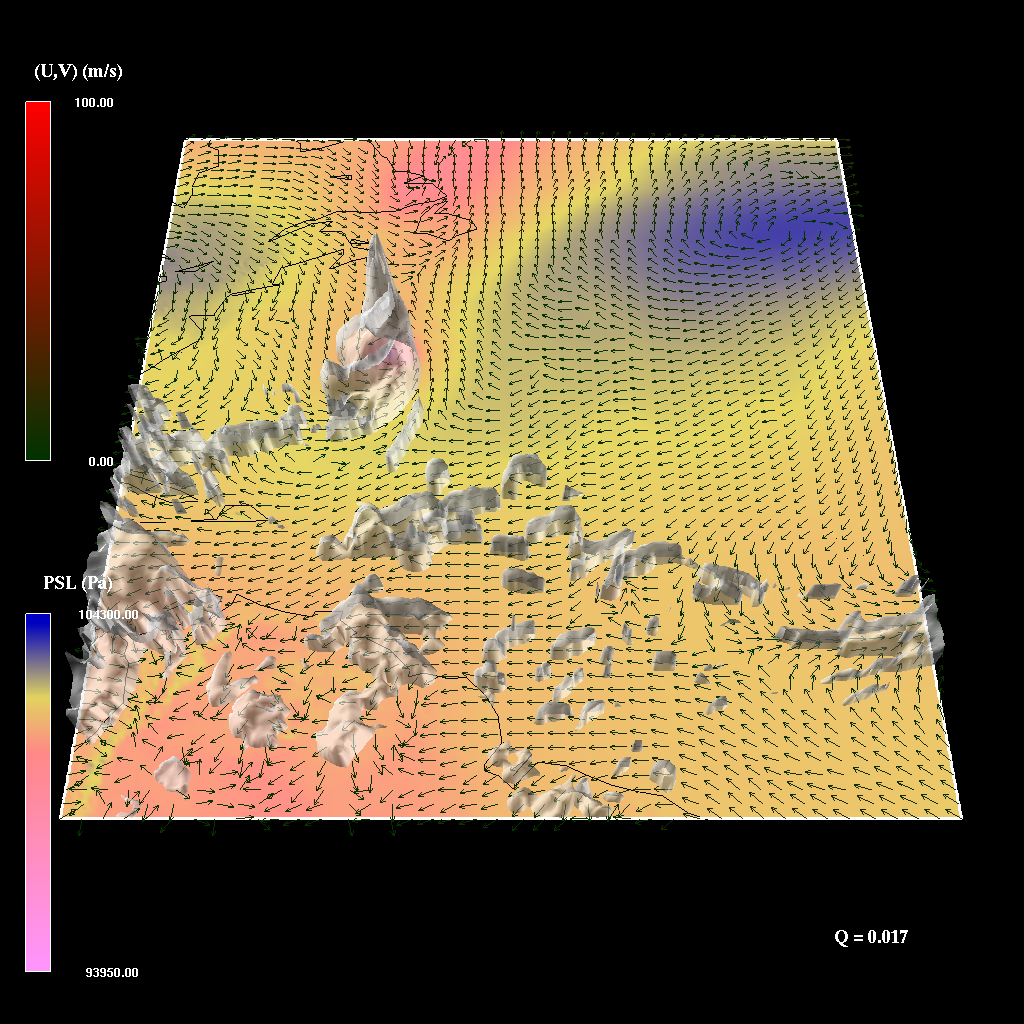
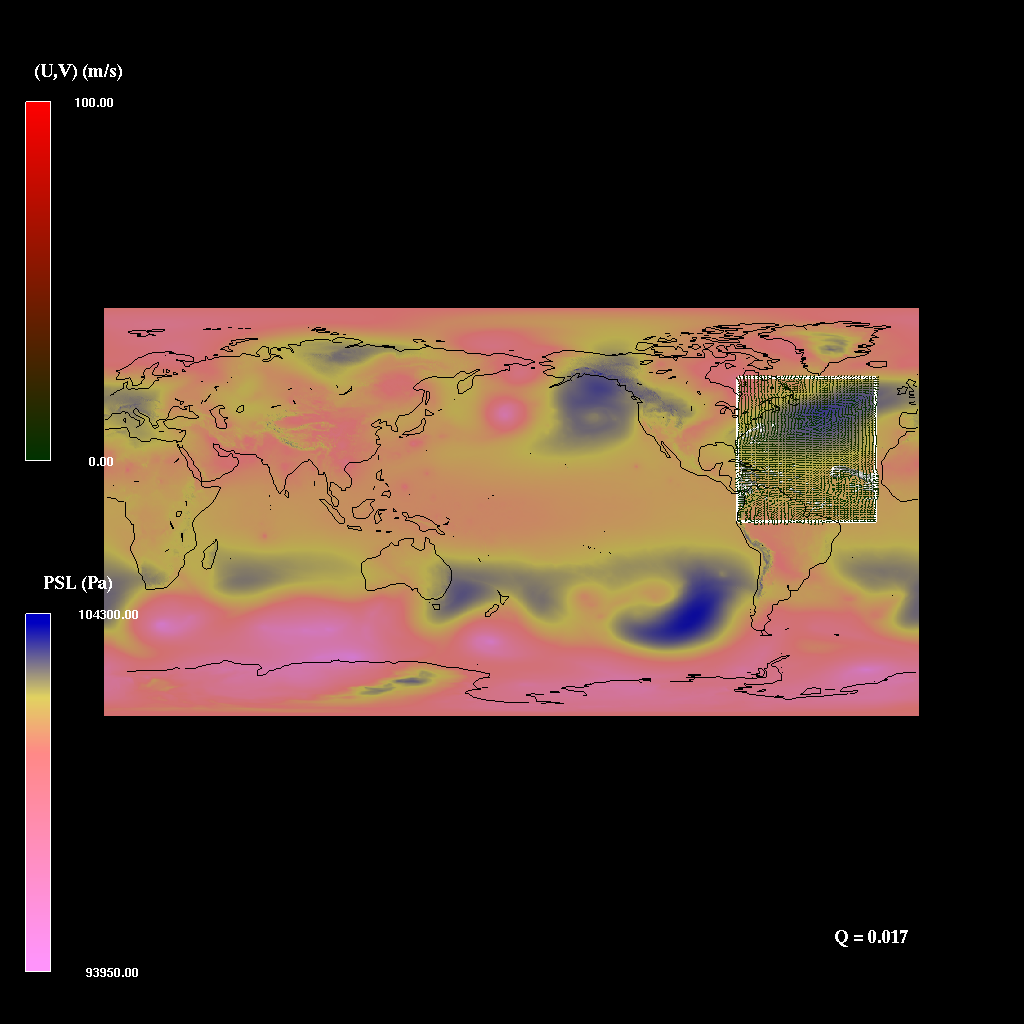
(4 Above) Time evolution visualizations of a September 1970 hurricane data set. For more information, images and video clips please see Cristina Siegerist's Project website. |
|||||