


Images & Movies
Statistical Visualization
Visualization of Function Fields With the increase in computing power and our ability to gather more and more data via increasingly powerful imaging and sensor technology, the size and complexity of scientific datasets continues to grow. Datasets that represent physical phenomena now contain billions of multi-valued, multi-dimensional, time-varying elements, and we are no longer able to fully analyze them. Despite these advances in complex data generation and acquisition, the majority of the research in scientific visualization has concentrated on the scalar field. Several mature visualization techniques exist for scalar fields, including isosurfaces, slicing, and volume rendering. In this project, we address function fields. Function fields map points in n-dimensional Euclidean space to one-dimensional scalar functions. Features in function fields are spatial regions where the functions are similar. Probes are used to derive scalar fields that show the similarity structure of function fields. Function fields themselves are just one of the myriad of data types that can populate the variables in a multi-dimensional dataset. Interactive exploration methods developed for function fields can be extended to multi-variate data; multi-variate data exhibits problems similar to function fields, including feature detection and segmentation, collisions, etc. The capability to visualize these complex fields allows us to gain insight into datasets we could not reach before. |
|||
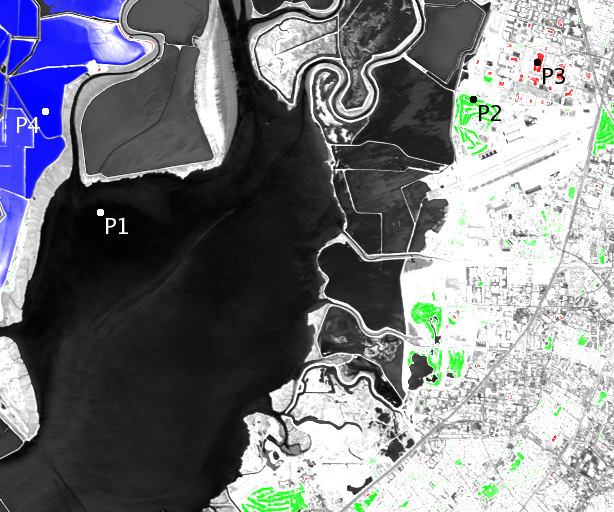
Interactive probing is used to derive a segmentation from a hyperspectral image of the San Francisco Bay. Golf courses, certain types of buildings, water, and evaporation ponds containing brine shrimp are shown in this image. |
|||