


Images & Movies
Turbulent Flow
 Visualization of Convective Flow with Integral Surfaces (Video Clip 48MB) Christoph Garth, Hari Krishnan, Kenneth I. Joy (Institute for Data Analysis and Visualization, University of California, Davis)** SciDAC VisNight 2010 Winner! ** |
||||
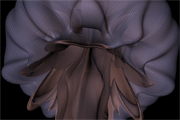
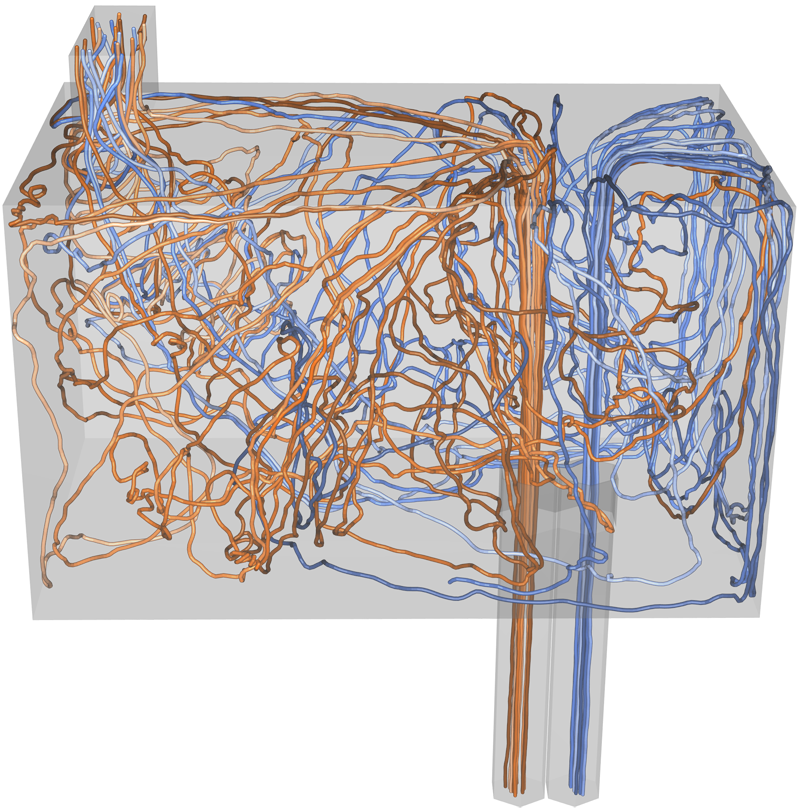
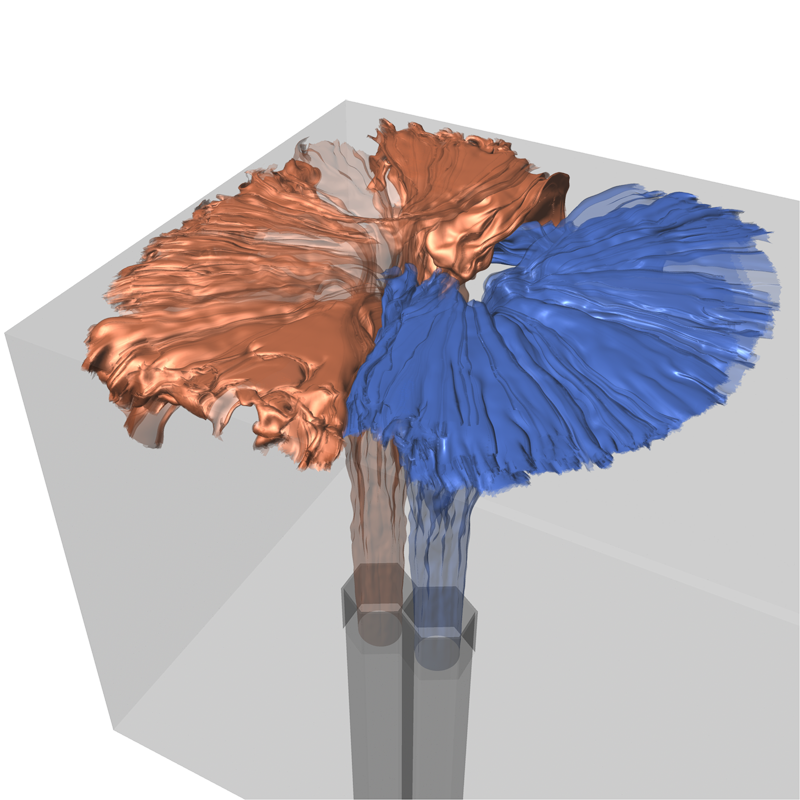
Using Streamlines to Visualize Thermal Convection Streamlines and stream surfaces thermal convection data set illustrate the mixing of air in a box. Warm (orange) and cold (blue) air are entering the box through two inlets. Although the warm air dominates one side of the box, both temperatures mix before ultimately exiting through the outlet in the upper right. From the streamline visualization (first image), it becomes apparent that while hot and cold air do mix, the mixing is not entirely optimal since no hot air penetrates into the lower left corner of the box.A stream surface visualization (second image) shows that the streams stay separated for some time after entering the box. The time-varying simulation was conducted by Paul Fischer and Alex Obabko (ANL) as part of an INCITE run using the Nek5000 spectral-element code. It consists of 23 million unstructured elements over 3600 time steps (only one timestep was used for the images below). Visualization: C. Garth and H. Childs, University of California, Davis |
||||
 |
 |
|||
Accurate and Efficient Integral Surfaces for Flow Visualization Integral surfaces, as a natural generalization of integral lines, are a basic yet powerful tool for insightful vector field visualization. Representing a continuum of integral lines, they constitute a surface and allow for the application of surface shading techniques. In comparison to streamlines or other line-based techniques, they support depth perception and greatly facilitate the visual understanding of complex three-dimensional structures. Such surfaces appear quite naturally in many problems that involve vector fields; the most prominent example is flow visualization that centers on the visual analysis of datasets generated by simulation or measurement. We have developed a novel approach for the direct computation of integral surfaces in general vector fields. As opposed to previous work, our approach is based on a separation of integral surface computation into two stages: surface approximation and generation of a graphical representation. This allows us to overcome several limitations of previous techniques. The presented approach facilitates a highly accurate treatment of very large time-varying vector fields in an efficient, streaming fashion. The given methods are applied to visualize vortex formation in an illustrative manner. - C. Garth, H. Krishnan, X. Tricoche and K.I. Joy. (University of California Davis) |
||||
Accurate and Efficient Integral Surfaces for Flow Visualization - C. Garth, H. Krishnan, X. Tricoche and K.I. Joy. (University of California Davis) Note: Winner of "People's Choice" award at SciDAC 2008. |
 |
Time and streak surfaces are ideal tools to illustrate time-varying vector fields since they directly appeal to the intuition about coherently moving particles. We present a novel algorithm for computing such surfaces that obtains as a result the entire evolution of a time or streak surface in a compact representation, allowing for interactive, high-quality rendering, visualization and exploration of the evolving surfaces in large datasets. - H. Krishnan, C. Garth and K.I. Joy. (University of California Davis) |
Visualization of coherent structures in turbulent flow: A Finite-Time Lyapunov Exponent volume rendering illustrates the formation of turbulence bubbles of increasingly at increasingly smaller scales. - C. Garth (University of California Davis) |
|
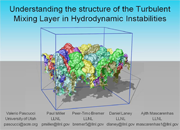
Understanding the Structure of the Turbulent Mixing Layer in Hydrodynamic Instabilities. V. Pascucci, P. Miller, P.-T. Bremer, D. Laney, A. Mascarenhas. |
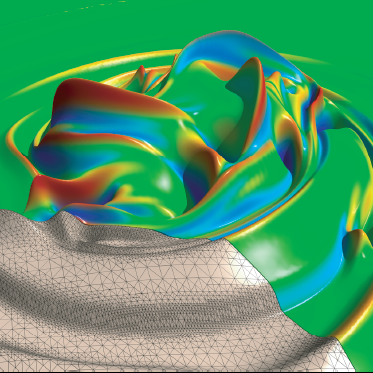
A visualization of a vortex roll-up from the impulsive
Rayleigh-Taylor instability at a density interface that shows baroclinic
vorticity production (color) superimposed on vorticity magnitude (height
representation). The adaptive mesh was generated by LLNL's multiresolution, view-dependent
terrain rendering system, SOAR, from a 2D data set produced by LLNL's Miranda code. |
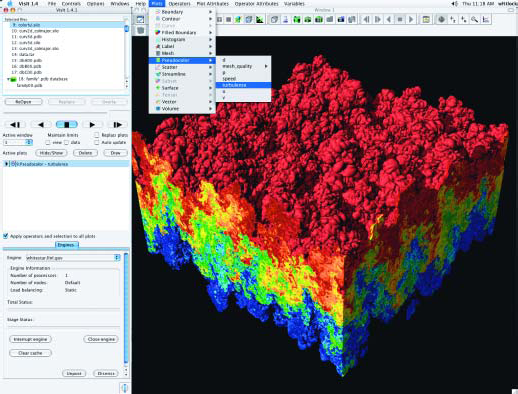
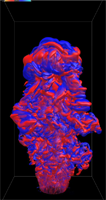
This image, created by Hank Childs of LLNL, is a visualization of a data set consisting of a twenty seven billion grid cell Rayleigh-Taylor simulation, which models the turbulent mixing of fluids. The simulation was done by MIRANDA, which also originated in ASC, but is now also being developed jointly with the SciDAC Physics Research Projects "Simulations of Turbulent Flows with Strong Shocks and Density Variations." |
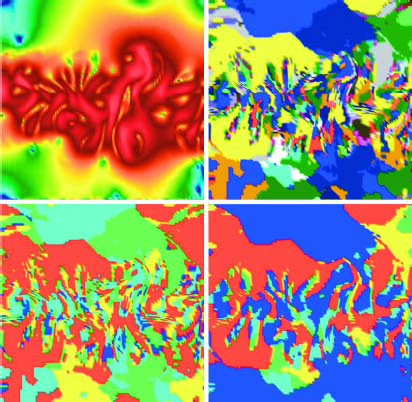
This image shows a visualization of an ensemble of 25 simulations. The upper left shows a single simulation, rendering the speed from a Rayleigh Taylor instability. The other three images are color coded to show which simulations have the maximum speed at any given point. The bottom right shows that the simulations that use extreme values for their viscosity coefficients (blue for low values of the coefficient and red for high values) tend to contain the maximum speed over all 25 simulations. |
|
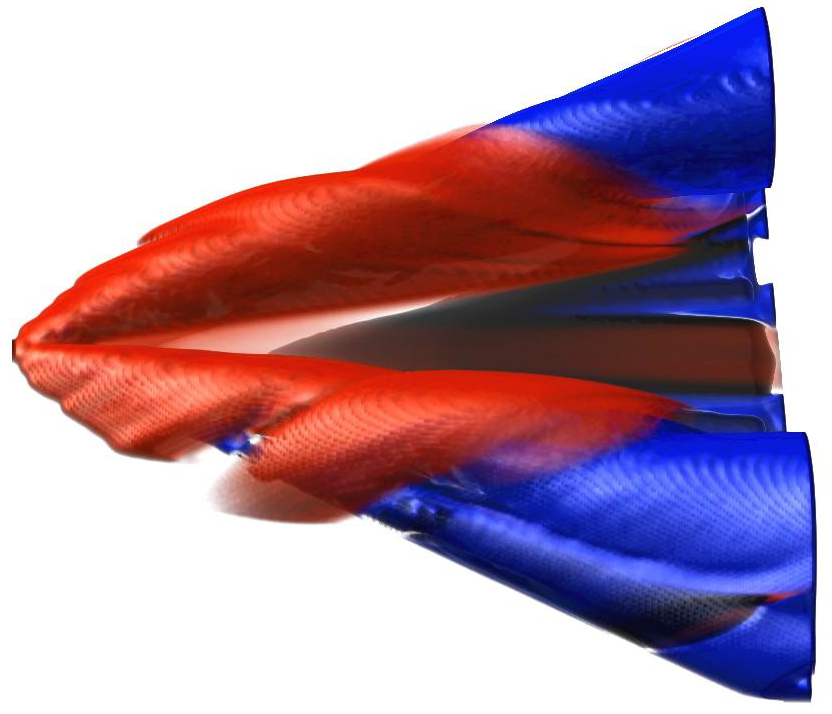
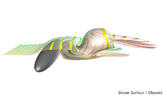
Visualization of coherent flow structures in a large scale delta wing dataset: Volume rendering of regions of high forward (red) and backward (blue) Finite Time Lyapunov Exponent. Coherent Structures appear as surfaces corresponding to the major vortices developing over the wing along the leading edge. Occlusion is a limitation that can be addressed with cropping or clipping. This image: Wing edge separation and the primary attachment layer. Inner structures are occluded. |
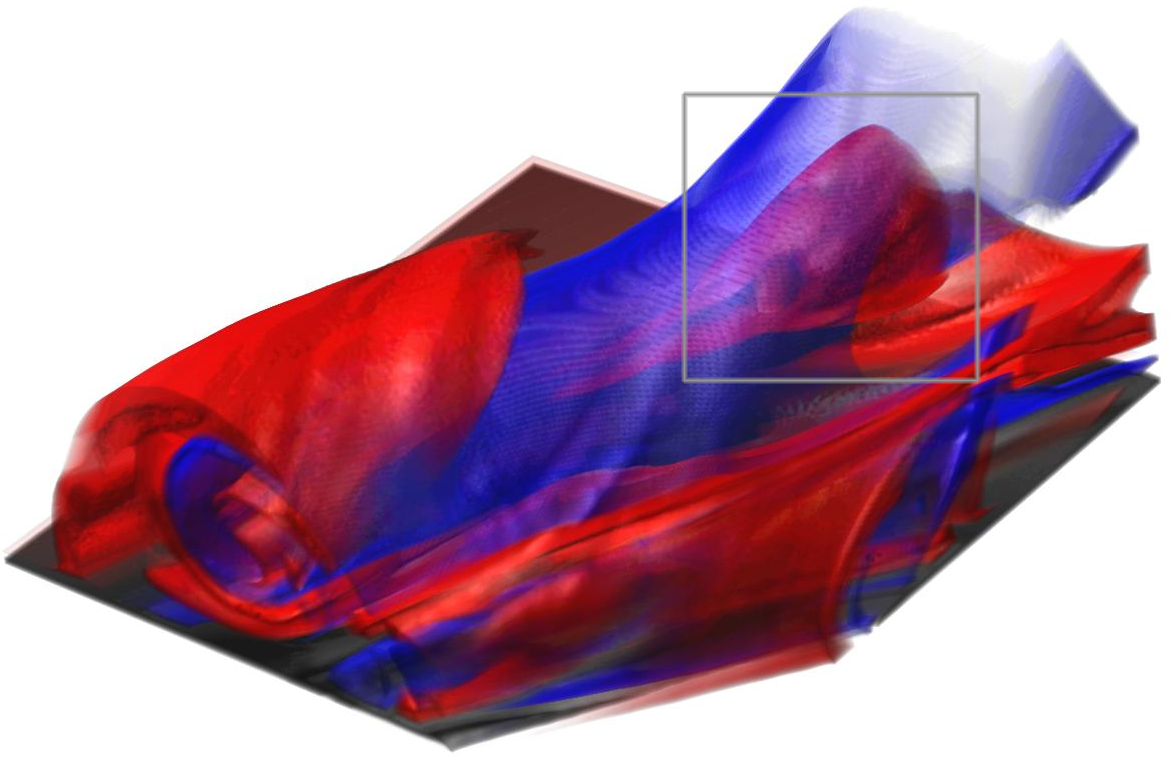
Visualization of coherent flow structures in a large scale delta wing dataset: Volume rendering of regions of high forward (red) and backward (blue) Finite Time Lyapunov Exponent. Coherent Structures appear as surfaces corresponding to the major vortices developing over the wing along the leading edge. Occlusion is a limitation that can be addressed with cropping or clipping. This image: Crop along the middle third of the left wing edge. The interplay of separation and attachment structures is visible on the front face. The grey box highlights the separation structure that characterizes a vortex breakdown bubble. |
|||
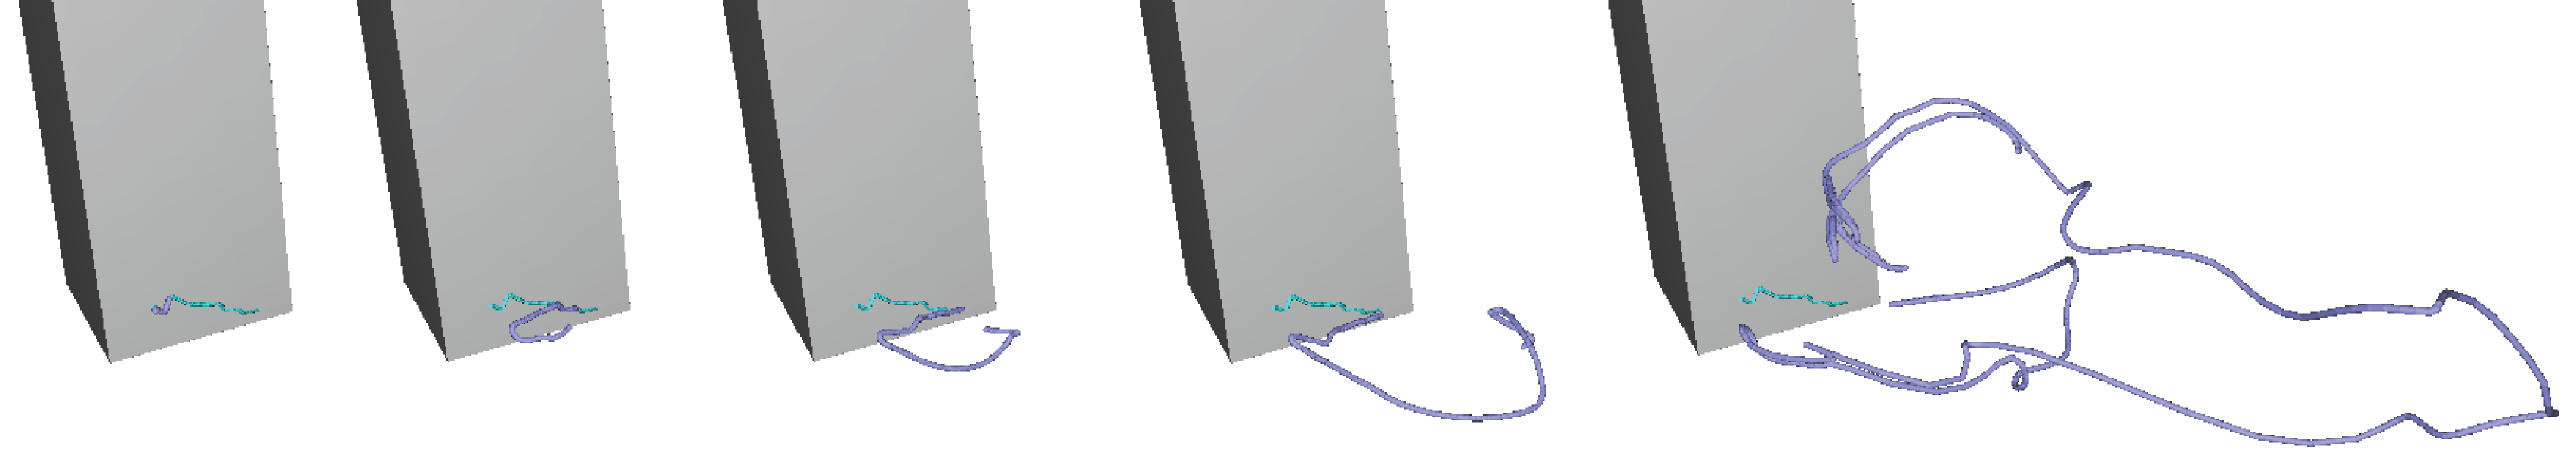
First image: Generalized streak line in flow past a cuboid dataset. The streak line (blue) starts from the moving position of the singularity. The positions, i.e. the path (turquoise), is located in the lower part of the cuboid. After the singularity reaches the Hopf bifurcation at the right end of the path the computation stops releasing new particles for the streak line. Thus the streak line separates from the singularity path (right most image). Authors: Alexander Wiebel, Xavier Tricoche, Dominic Schneider, Heike J�nicke, Gerik Scheuermann. |
||||
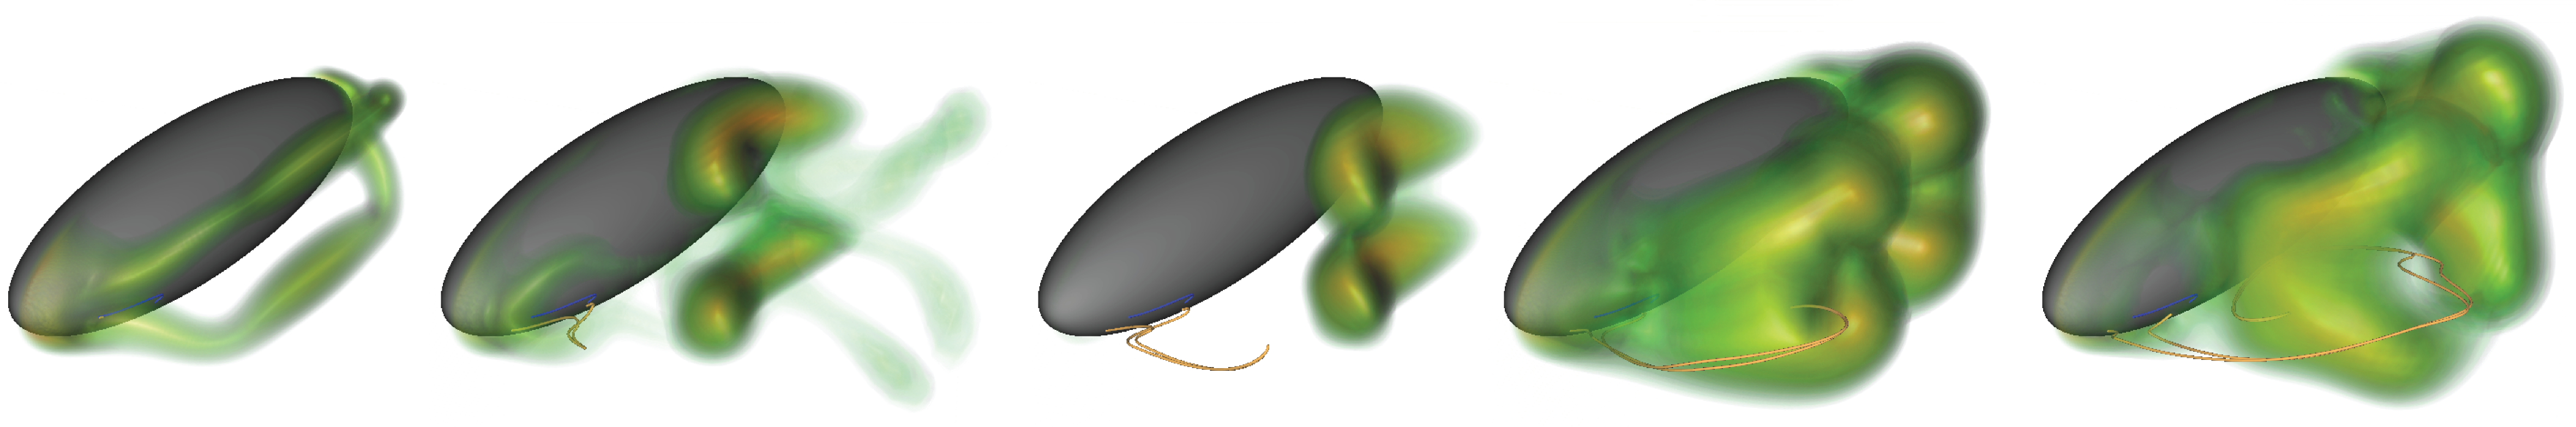
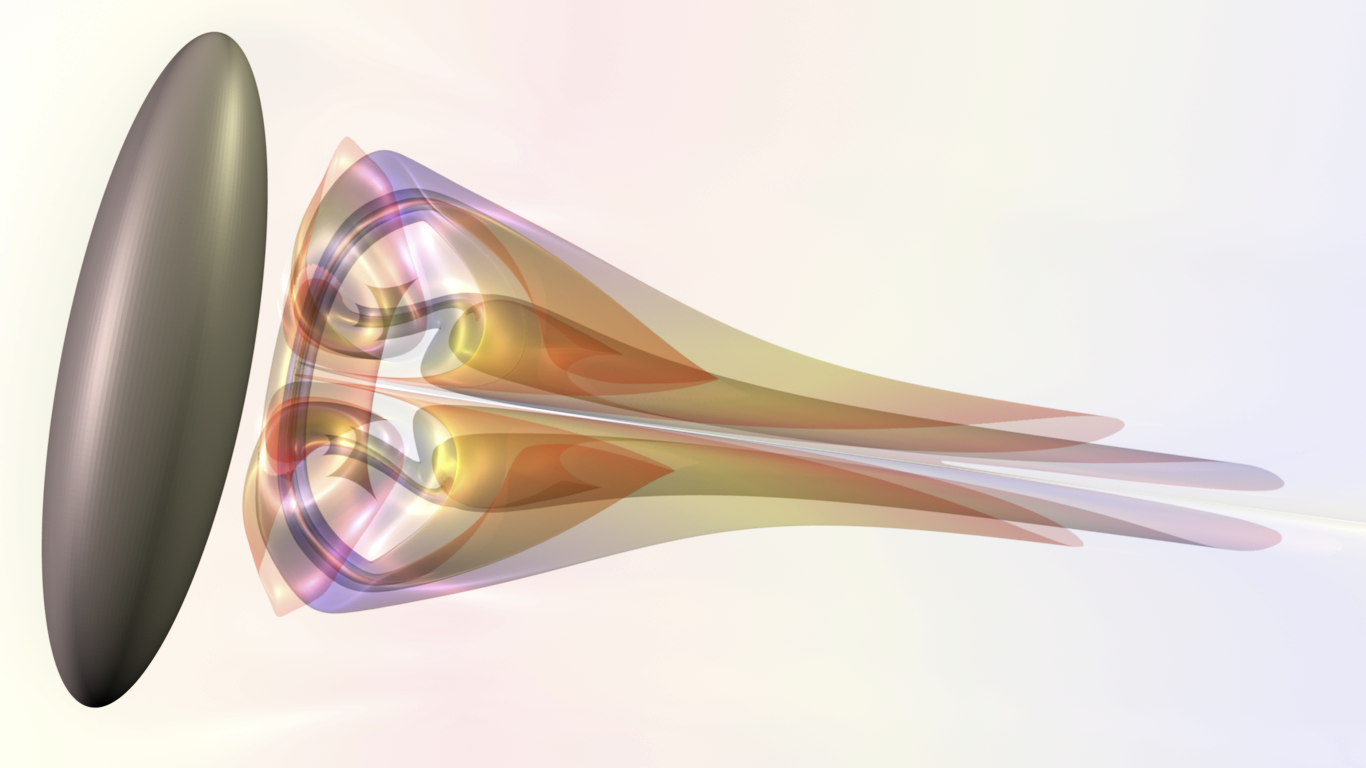
Second image: Snapshots taken from an animation of generalized streak line and volume rendering of pressure in a flow past an ellipsoid dataset. Low pressure, which is correlated to vortical activity, is mapped to high opacity. The generalized streak line starts from the blue sink path in the lower left of the images (see e.g. third image). Authors: Alexander Wiebel, Xavier Tricoche, Dominic Schneider, Heike J�nicke, Gerik Scheuermann. |
||||