


Images & Movies
Combustion
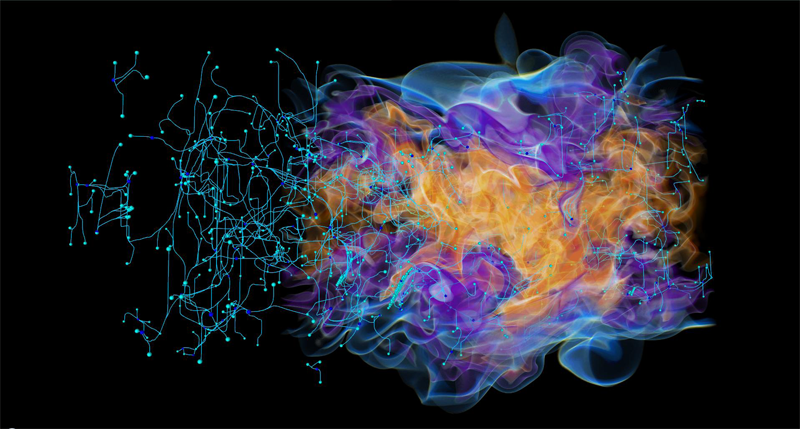 Analysis of a temporally-evolving turbulent CO/H2 jet flame undergoing extinction and reignition at different Reynolds numbers. This image shows identification of the centers of the basins of mixture fraction in DNS combustion simulation results. |
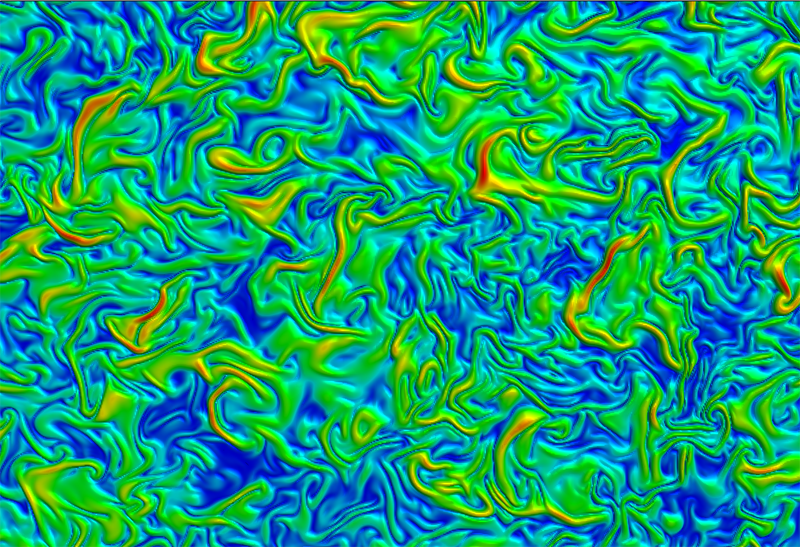 Chi field at y=448 of time step 100 drawn using a logarithmic color map. |
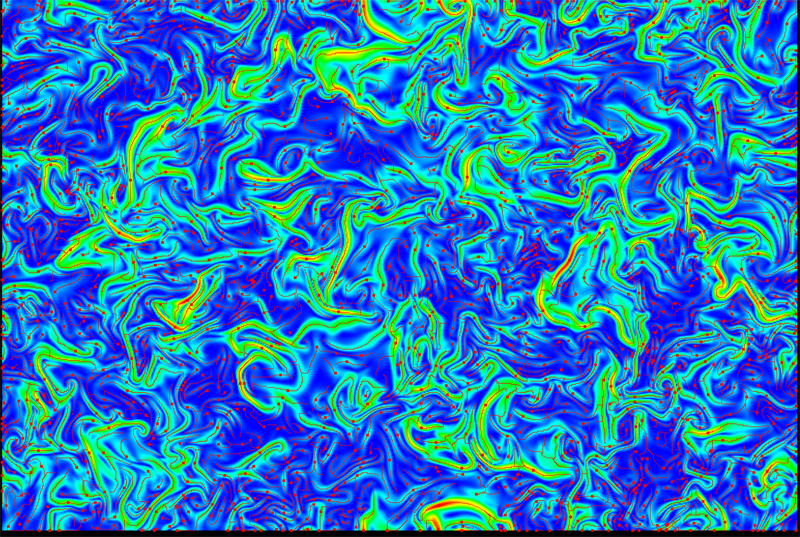
Chi field at y=448 of time step 100 drawn using a logarithmic color map. Ascending lines of the MS complexfiltered by gradient magnitude. |
|
Topological Analysis and Time Tracking of Cellular Burning Structures in Lean Premixed Hydrogen Flames. P.-T. Bremer, V. Pascucci, G. Weber, J. Bell, and M. Day. |

Tracking High Scalar Dissipation Rate Features in Non-premixed Flames. A. Mascarenhas, P.-T. Bremer, V. Pascucci, J. Chen, R. Grout, and E. Hawkes. |
Query Driven Visualization
|
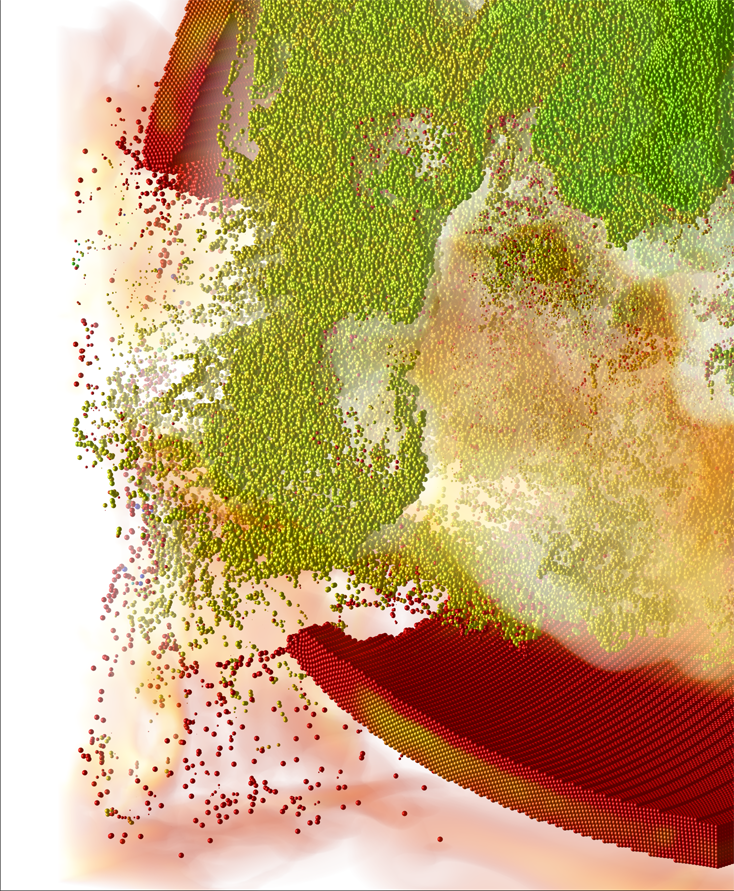
Our ability to generate ever-larger, increasingly-complex data, has established the need for scalable methods that identify, and provide insight into, important variable trends and interactions. Query-driven methods are among the small subset of techniques that are able to address both large and highly complex datasets. We present a method that increases the utility of query-driven techniques by visually conveying statistical information about the trends that exist between variables in a query. In this method, correlation fields, created between pairs of variables, are used with the cumulative distribution functions of variables expressed in a user's query. This integrated use of cumulative distribution functions and correlation fields visually reveals, with respect to the solution space of the query, statistically important interactions between any three variables, and allows for trends between these variables to be readily identified. The image sets below show the results of a new technique for revealing the relationships between variables in complex, multivariate datasets. We demonstrate our method by analyzing interactions between variables in two combustion simulations: a methane V-flame (image 1), and an ultra-lean premixed hydrogen flame (images 2 and 3). 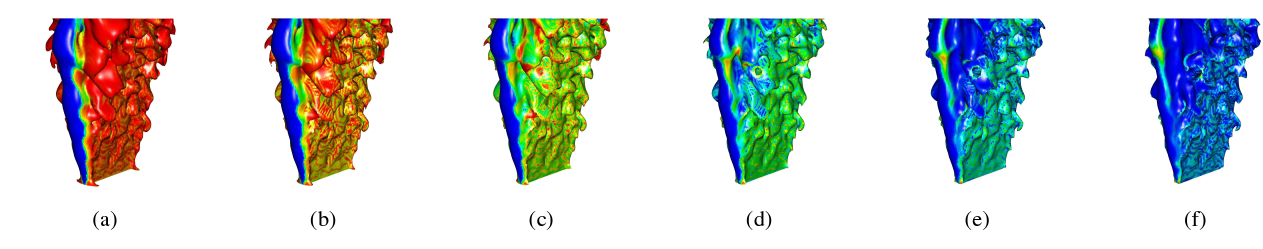 These images depict increasing ((a) through (f)) isosurface values of temperature (isotherms) colored by values of the correlation field derived from water (H2O) and ethylene (C2H4). As temperature values increase, the predominant correlation between H2O and C2H4 along the isotherms shifts from strongly positive (red) in (a), to strongly negative (blue) in (f). This shift suggests that temperature is itself negatively correlated with the H2 O-C2 H4 correlation. Images generated by Luke Gosink using VisIt. Data provided by Marc Day and John Bell from - Center for Computational Sciences and Engineering at LBNL 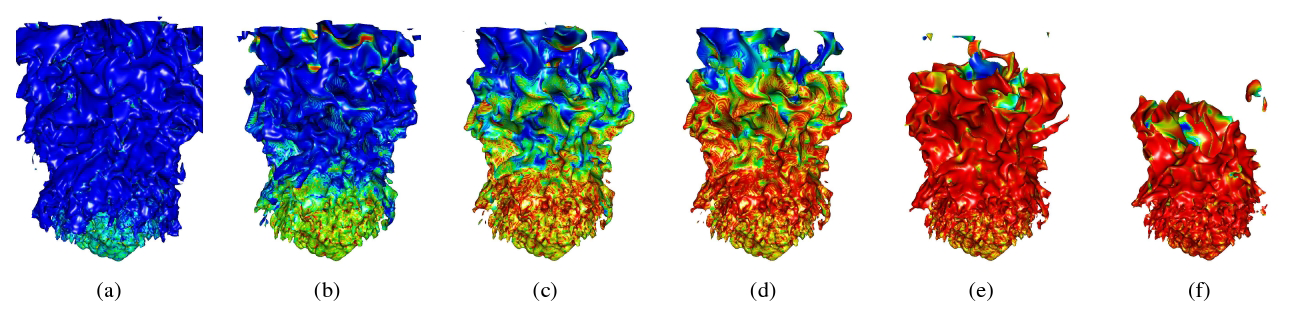 These images depict increasing ((a) through (f)) iso-concentrations of water (H2O) colored by values from the correlation field of oxygen (O2) and perhydroxyl radical (HO2). As water concentration increases, the predominant correlation along the isosurface shifts from strongly negative (blue) in (a), to strongly positive (red) in (f). This shift suggests that H2O concentration is itself positively correlated with the O2-HO2 correlation. Local variations in this observed correlation (e.g., the bottom of the isosurfaces transitioning from negative correlation to positive correlation faster than the top of the isosurfaces) are due to the fact that burning occurs unevenly along the isotherms. Such variations in combustion influences both the rates of reactions and the locations of reaction fronts. As such, transitions in correlation are expected to occur at different concentrations in the isosurfaces of H2O. Images generated by Luke Gosink using VisIt. Data provided by Marc Day and John Bell from - Center for Computational Sciences and Engineering at LBNL 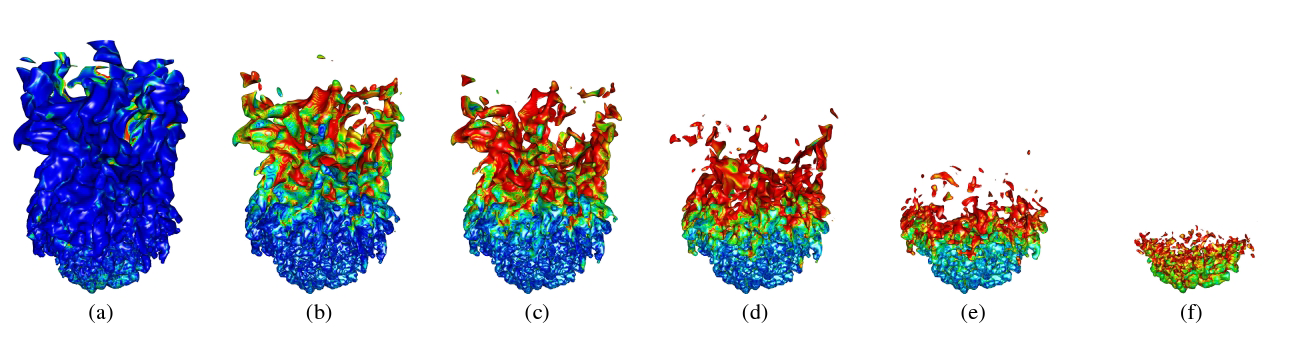 These images depict increasing ((a) through (f)) iso-concentrations of hydrogen radicals (H) colored by values from the correlation field of oxygen (O2) and perhydroxyl radical (HO2). Each isosurface exhibits striations in the correlation field (i.e., bands of negative, zero, and positive correlation), and as H concentration increases, correlation increases within each striation (i.e., negative correlation tends to become positive). This behavior suggests that H concentration is itself positively correlated with the O2 -HO2 correlation. Image (f) indicates the simultaneous existence of near-zero correlation (i.e., high entropy) and high H concentrations. Images generated by Luke Gosink using VisIt. Data provided by Marc Day and John Bell from - Center for Computational Sciences and Engineering at LBNL 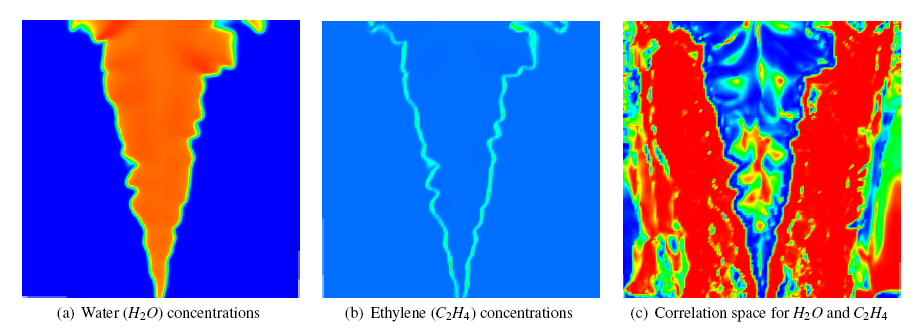 These images show a new technique for revealing the relationships between variables in a complex, multivariate dataset. The left and middle images show false-colored slices of Water (H2O) and ethylene (C2H4) concentrations from a methane combustion dataset; red corresponds to high density, blue to low density. The right image shows a false-colored slice of the derived correlation field for these two compounds; red corresponds to strong positive correlation, blue to strong negative correlation, and green to little or no correlation. The switch from strong positive correlation to strong negative correlation in the reaction region corresponds to the area in which C2H4 is both produced and consumed, and H2O is produced, in the process of combustion. The strong correlation (both positive and negative) in the center of the flame, as well as the atmospheric region, demonstrates the correlation field�s ability to show fine-scale interactions. Authors: Luke Gosink, John C. Anderson, Wes Bethel, Ken Joy. Data provided by Marc Day and John Bell from - Center for Computational Sciences and Engineering at LBNL |
|||
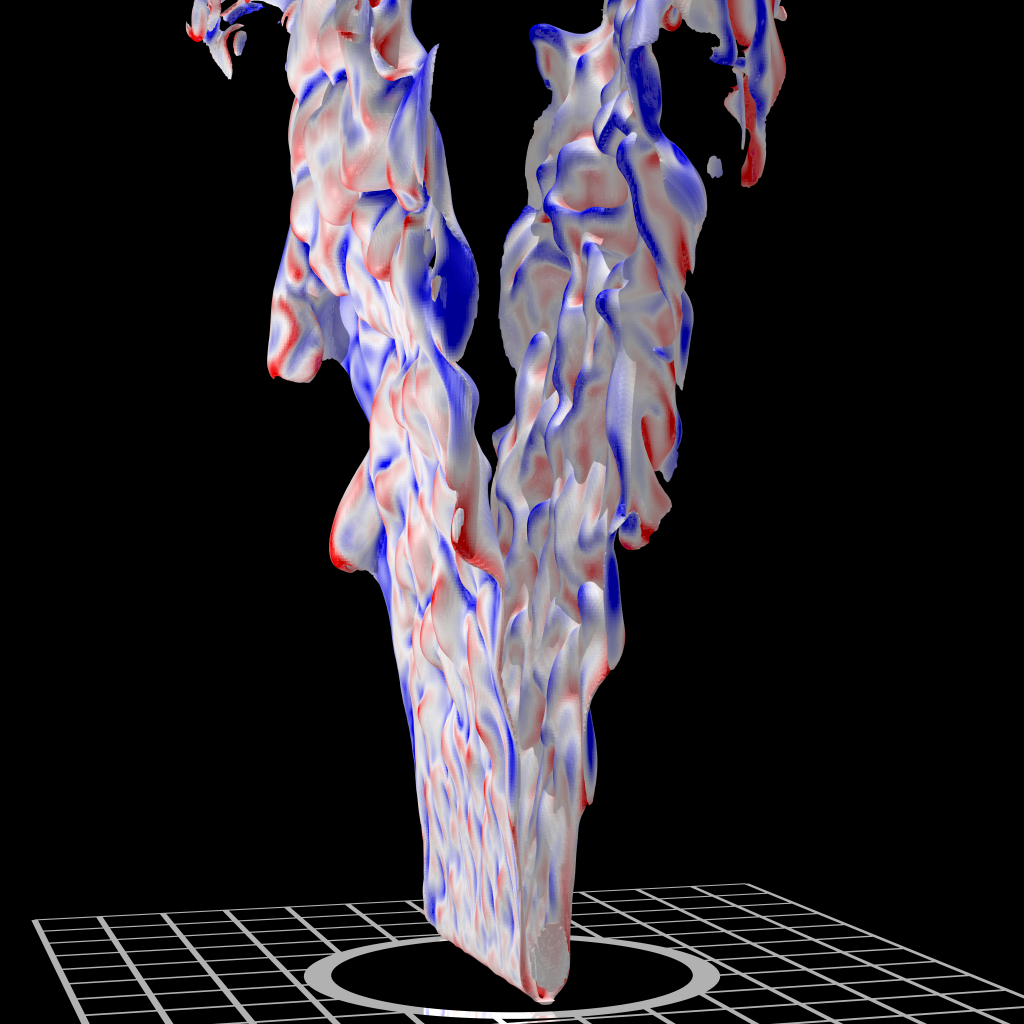
Rod-stabilized V-flame. |

Rod-stabilized V-flame. |
Sectional view of a rupturing steel container that is filled with a plastic bonded explosive and heated by a fire. |
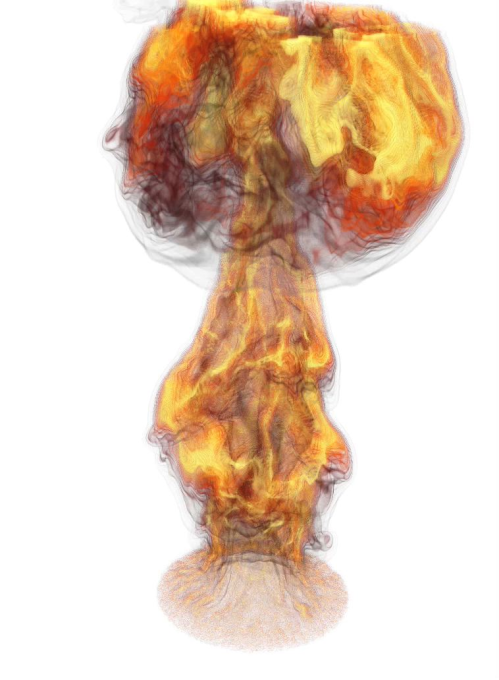
CH4 pool fire simulation. |